.svg)
Healthcare price transparency data for research: Serif Health is now on Dewey

In 2022, federal Transparency in Coverage (TiC) regulations required U.S. commercial insurers to publish the prices they negotiate with hospitals and physicians, information that had always been confidential. These negotiated rates now have to be published monthly as machine-readable files, so a researcher, an employer, or a curious patient can see the actual dollar amount an insurer pays for a check-up, a hip replacement, or an MRI.
Insurers largely complied, and the disclosure was enormous: postings containing a trillion prices and hundreds of terabytes of data. Yet as researchers have observed, this data “have not been widely used, largely due to data structure and complexity” (Whaley and Chartock (2025)). Research so far has focused on small slices of the data that they can find and process (such as Oakes et al. (2024) examination of hip and knee replacement prices), but much more work is needed to understand market-wide variation.
Data transparency is one thing, data usability is another. That’s where Serif Health steps in.
What makes Transparency in Coverage data hard to use
The raw TiC files are famously difficult to work with. The Congressional Research Service has documented challenges with access (expiring links, scattered repositories), size and format (huge files, inconsistent naming), and integrity, and one vendor estimates up to 300 TB of new postings every month. The best known integrity problem is “ghost rates”: posted prices for services a provider would never perform, like a heart transplant rate listed for a psychiatrist. Muhlestein (2025) estimated that across 61 insurers, 91.8% of all posted rates were ghost rates, and even among the 100 most common billing codes, 70.3% were.
Regulators are starting to catch up. In December 2025, CMS and the Departments of Labor and Treasury proposed amendments requiring insurers to strip out ghost rates, add usage context, and shrink file sizes by an estimated 70%, with implementation targeted for 2027, with Health Affairs Forefront tracking the rulemaking through 2026.
Notably, the government proposal points to Serif Health's own analysis of the raw files in their recommendations.
What's in the Serif Health negotiated rates datasets
Serif Health ingests and cleans payer files at scale. Their datasets, now included in every Dewey subscription, cover negotiated rates for the 293 most commonly billed medical codes across the four largest national commercial PPO networks: Aetna, Cigna, Blue Cross Blue Shield, and UnitedHealthcare. Each record links a specific provider, billing code, rate, care setting, and contract type, rebuilt monthly from insurer postings.
The data shows the whole price list, not just the receipts: claims only reveal a price when a service was actually used, while this dataset discloses the full negotiated fee schedule for every contracted provider and code. Because the same provider appears across all four networks in an identical format, it's easy to compare what different insurers pay the same doctor or hospital. The files are also enriched with provider specialty information, addresses that can be mapped to a ZIP code, and built-in comparisons to Medicare rates.
Serif Health also removes ghost rates before the data ever reaches Dewey, checking each code against what providers actually bill in nationwide claims data, and flags which rates passed which checks so researchers can apply their own inclusion rules.
A note on scope: this data reflects negotiated prices, not the volume of services delivered. Medicare, Medicaid, and out-of-network payments aren't included, though built-in Medicare comparisons help bridge that gap. Pairing this data with a claims or volume source lets you study spending and utilization directly.
What negotiated rates look like: a California example
A routine office visit (CPT 99213) under Blue Cross Blue Shield's Blue Card PPO carries a statewide median of $66 in California, but the price a given provider is paid for the exact same visit ranges from under $50 to over $80 depending on where they're located and who they've negotiated with.
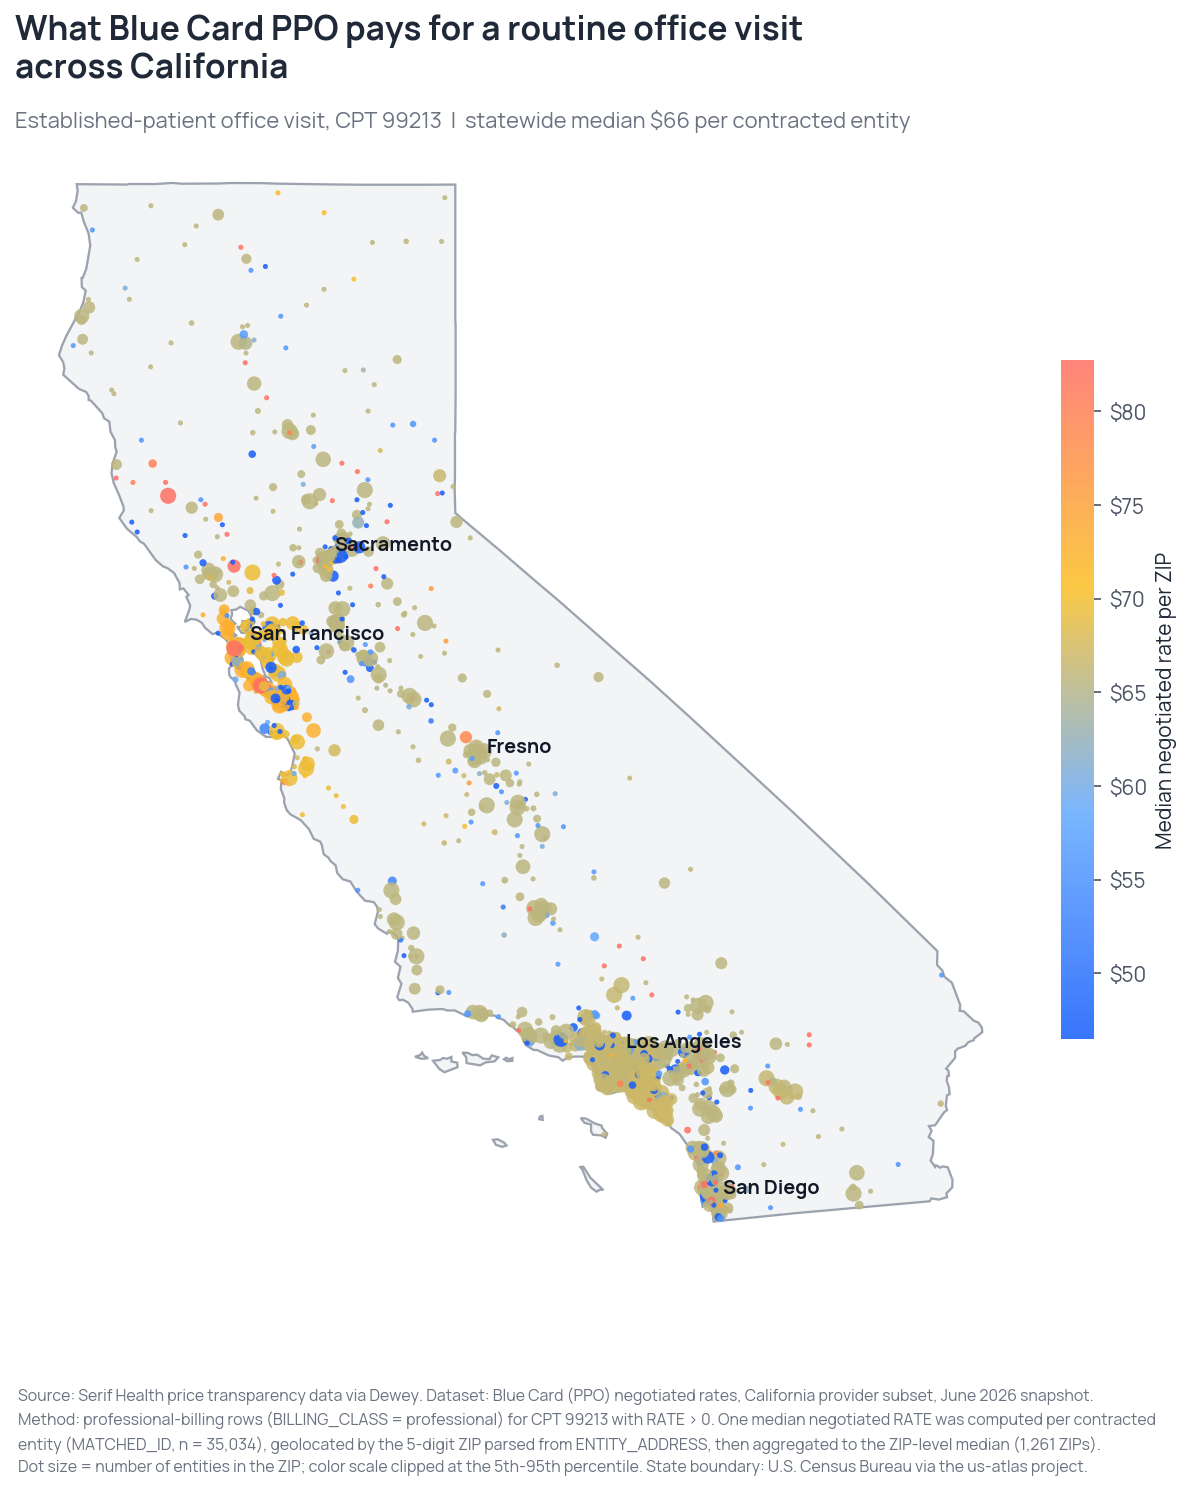
For scale, California alone accounts for roughly 85,000 contracted entities and 8.2 million negotiated rates in the Blue Card file, across just under 300 billing codes.
Where research using Transparency in Coverage data is headed
Early research on TiC data has mostly focused on describing the scale of price variation and testing how trustworthy the raw files are. The newest work is starting to explain that variation: Philips, Radhakrishnan, Whaley, and Singh (2025) used negotiated rates to show that hospital-affiliated specialists charge 16 to 21% more than independent physicians for the same cardiology and gastroenterology services.
A few starting points for researchers in health policy, health economics, and health services research:
- Test how much of that hospital-affiliation premium holds up across all 293 codes and four networks once you control for geography and specialty.
- Join provider addresses to Census or CDC PLACES data (also on Dewey) to see whether higher-priced markets show better health outcomes once demographics are held constant.
- Compare what different insurers pay the very same provider, since the same entities appear across all four networks, to study payer strategy and network design.
Learn more
Explore the Serif Health datasets on Dewey, browse the documentation, or check out Serif Health's Knowledge Base for more on the data. And if you're already digging in, let us know what you think!




.svg)