.svg)
Getting the most value from the Dewey subscription: a look at institutional subscription trends

Balancing university budgets is an ongoing trapeze act over the quagmire of dwindling funds, shifting demands, and escalating costs. How do you decide if a Dewey subscription is worth the price tag? What is the real value to researchers at your university? We answer that with what we do best: by giving you the data.
This snapshot of how researchers consume data from the Dewey platform comes from (anonymized) usage data at our 40+ subscribed institutions. We’re giving you benchmarking insights into questions like: how will usage change over time? What departments are downloading the most data? Is the institutional subscription worth it or should I push my researchers towards individual licenses or subscriptions? Dive into the data with us and see for yourself.
Breaking down commercial data consumption trends at Dewey universities
The main question most librarians wonder is whether their researchers will actually use the data on the Dewey platform? That’s the real value variable, so here’s what you can expect: adoption is fast, and when a university-wide subscription is set up, the median time from account creation to the first dataset download is under a week.
On average, an institution has about 20 users within the first month, 90 by 6 months, and about 160 by the 1-year mark, with some well over 300 researchers.
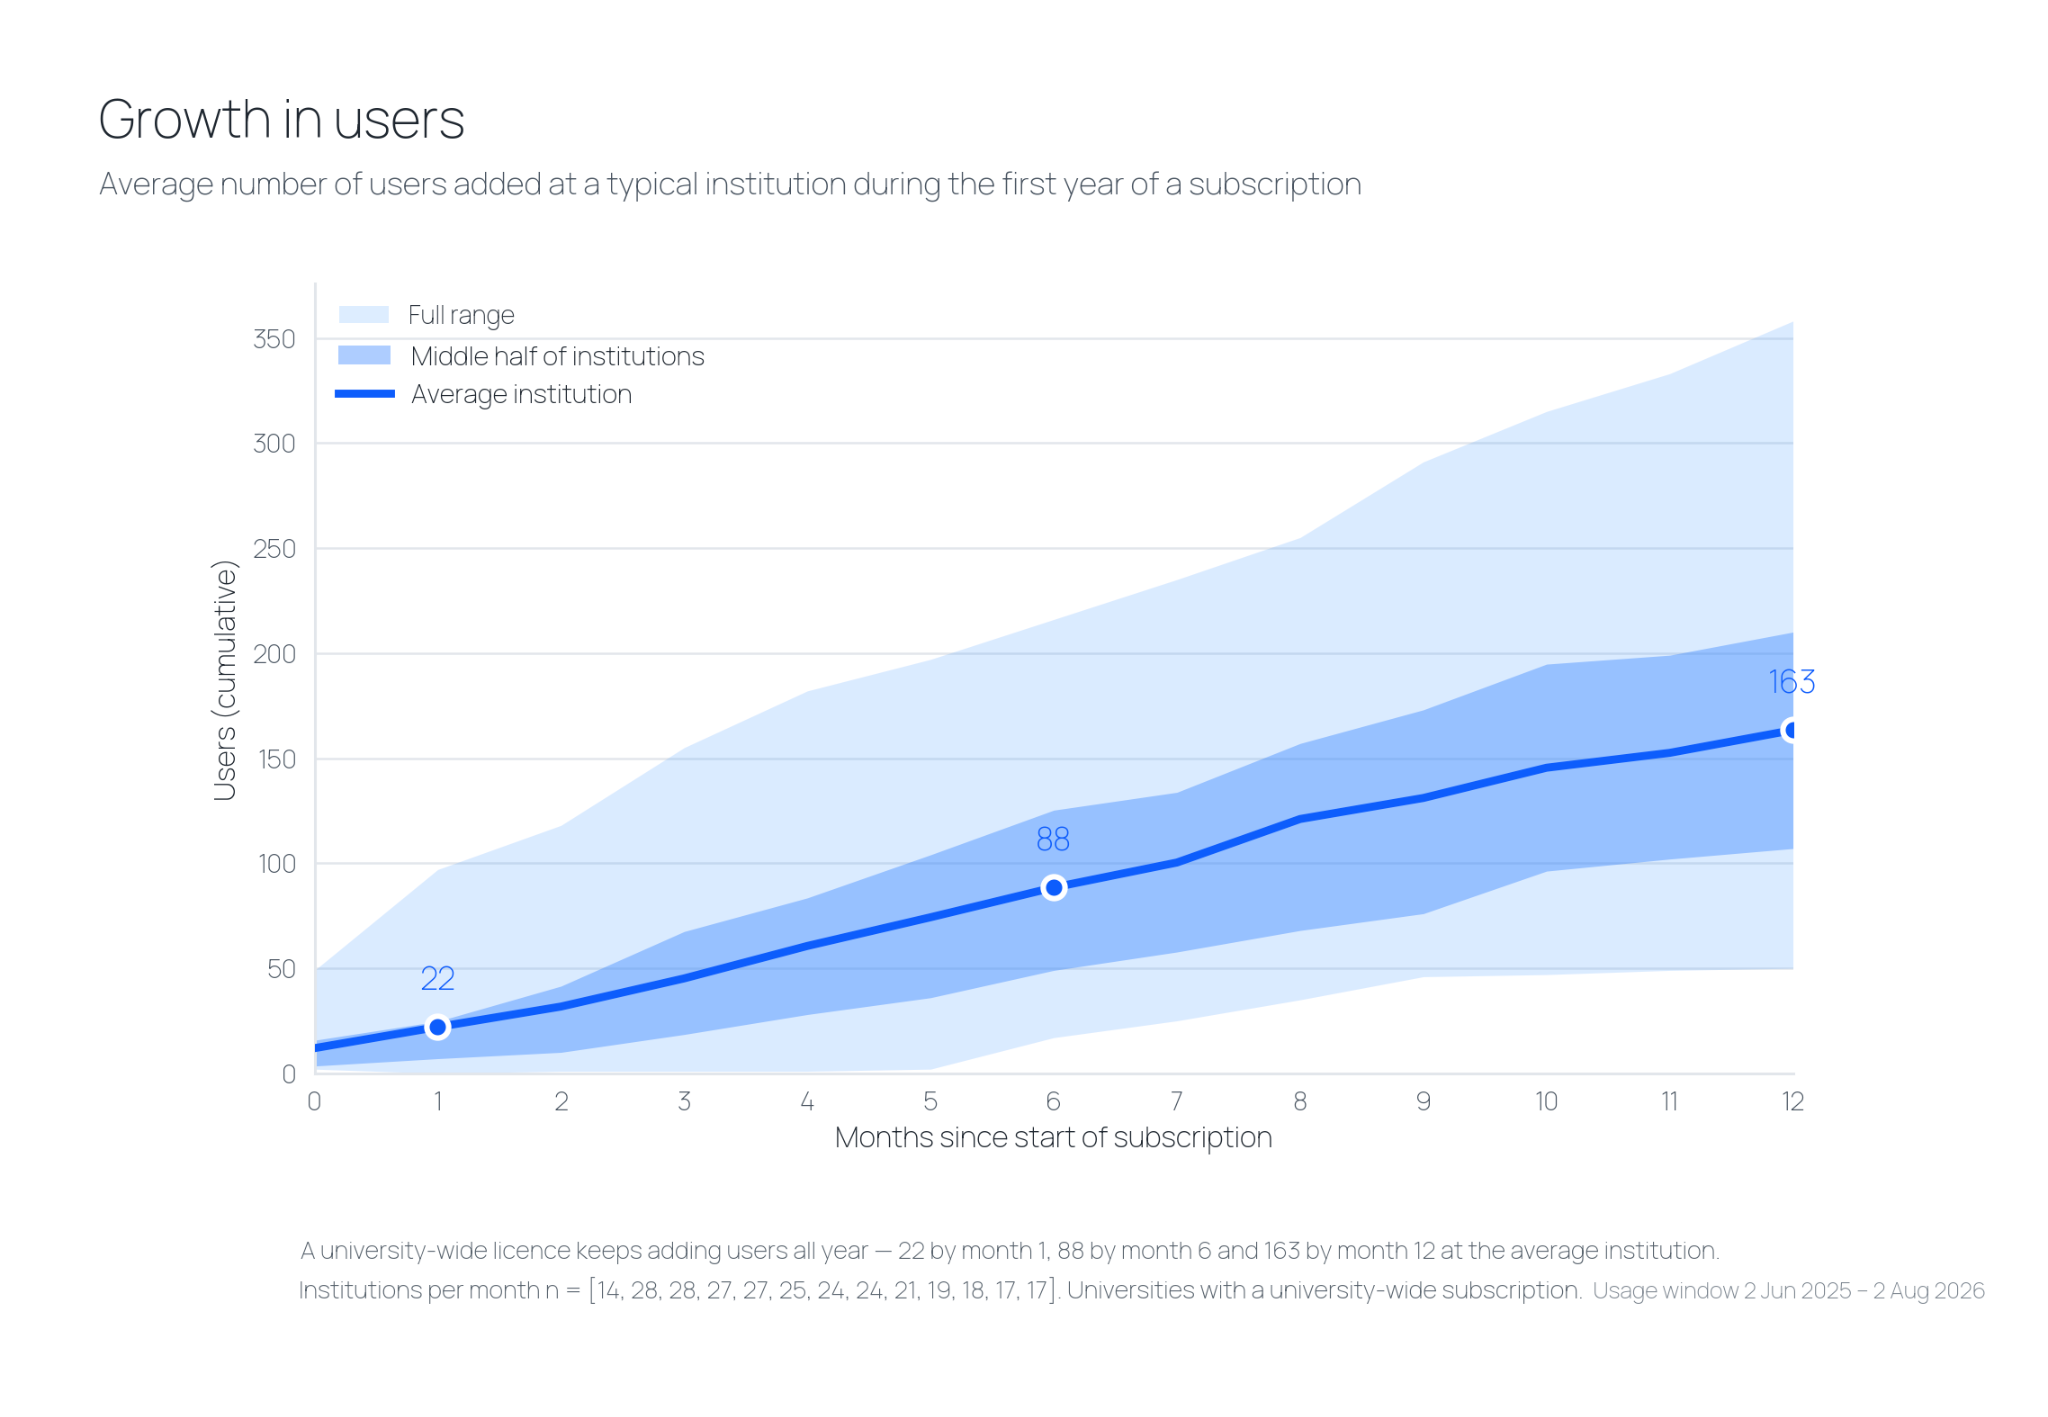
But the number of researchers on the platform is only half of the equation: how much data they are downloading really speaks to the value they find in it. And whether you look at the variety of data providers and datasets or the TB of data consumed, the numbers reveal the working engine behind a research institution.
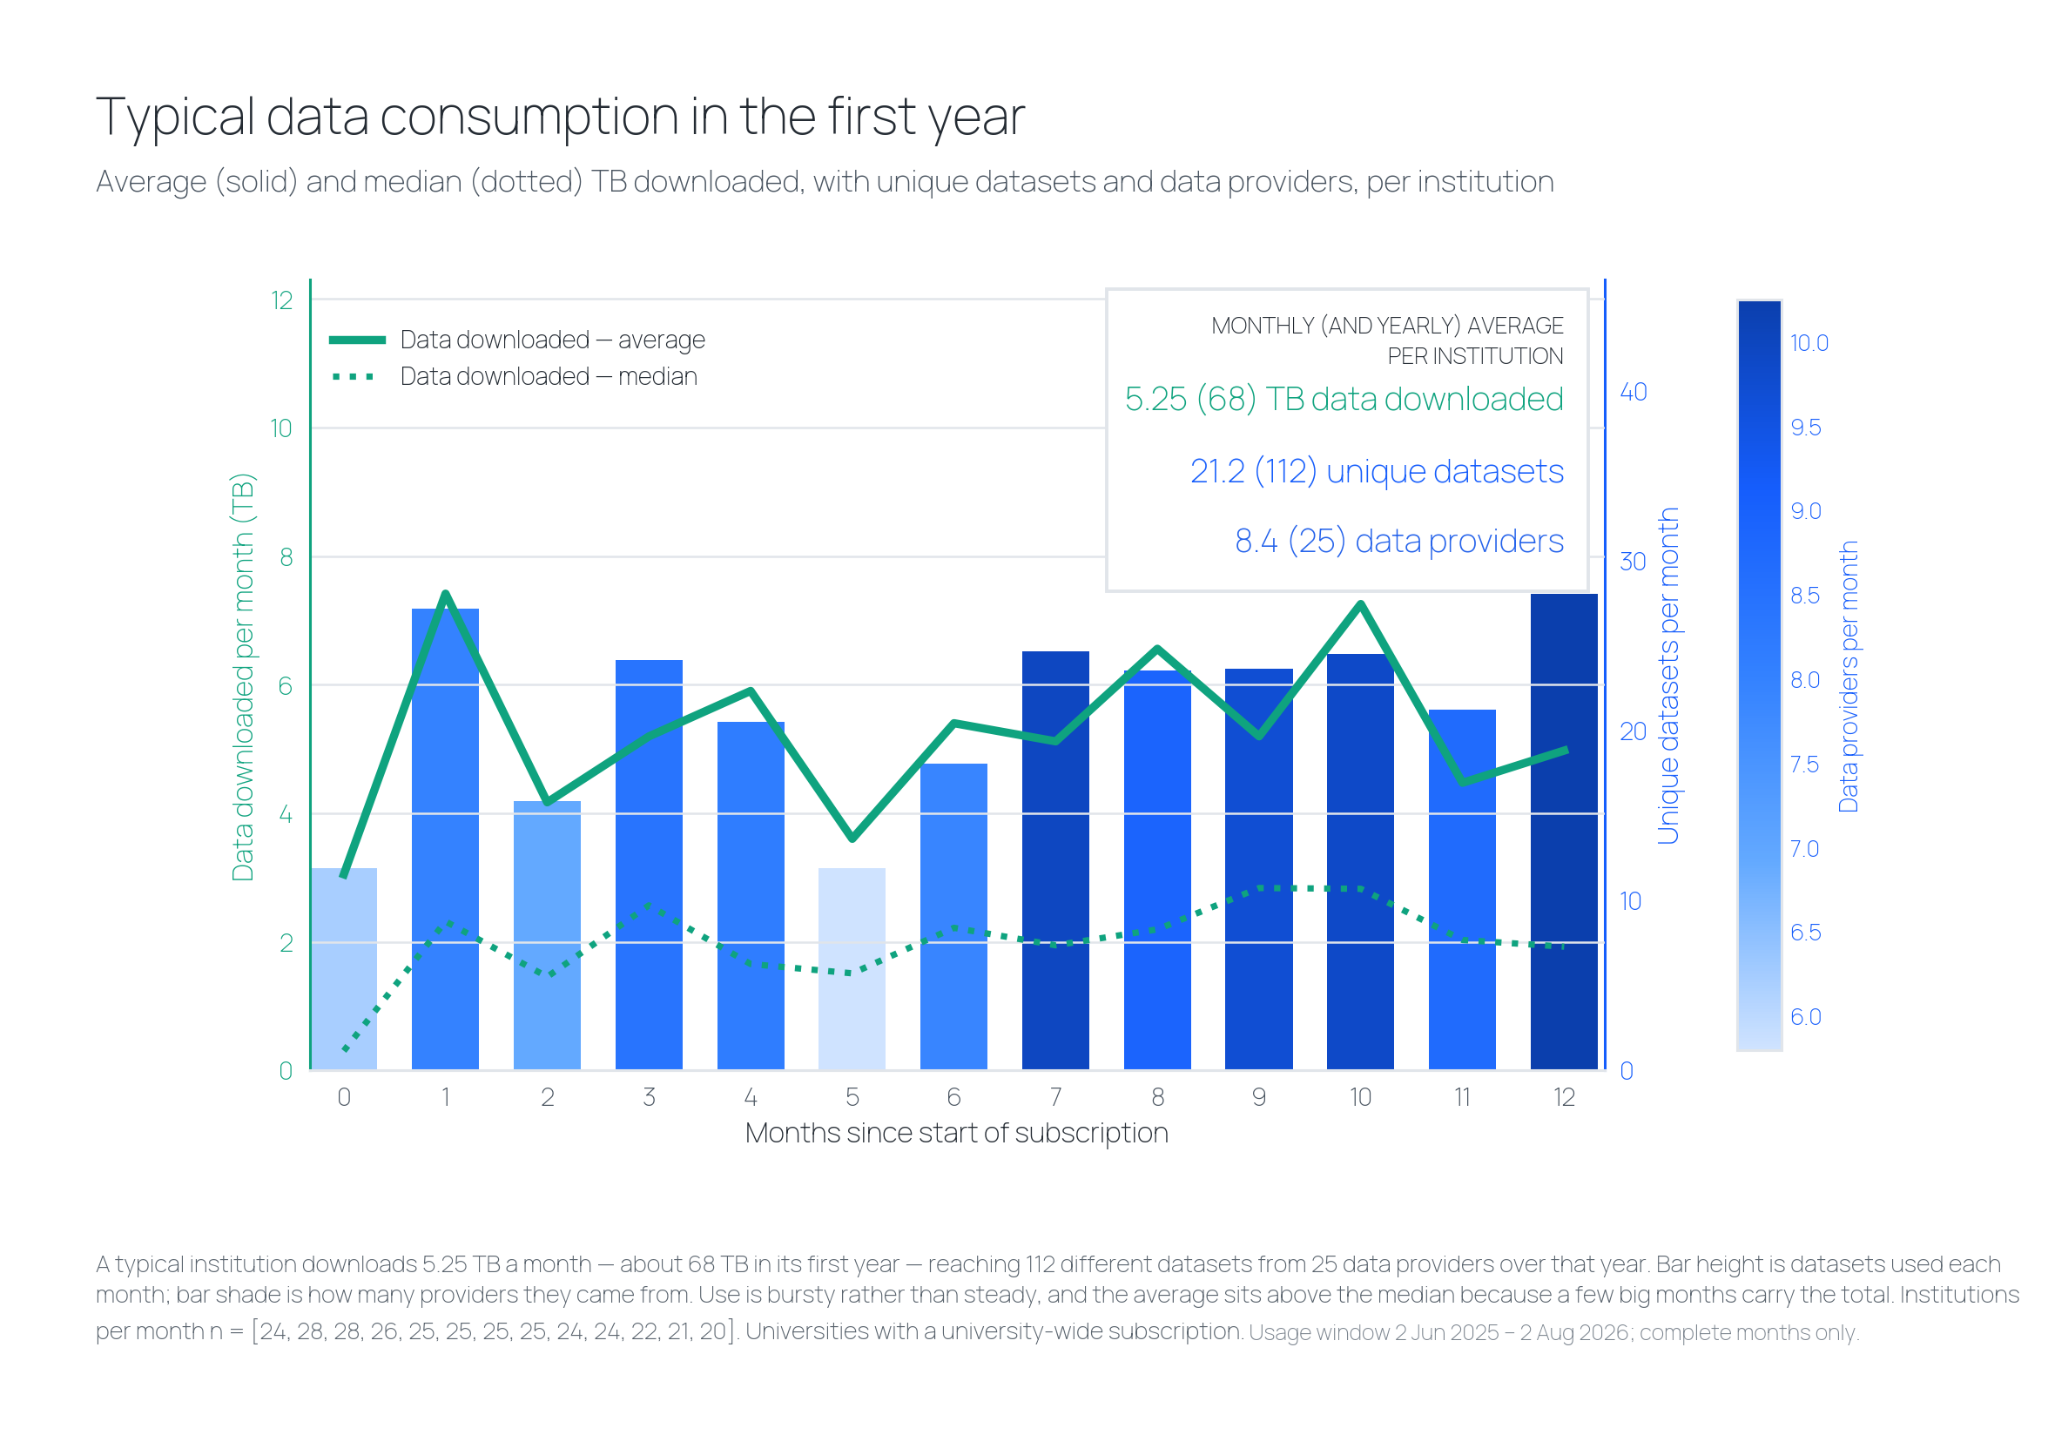
Across the first year, researchers are downloading an average of 5 TB of data a month and about 70 TB a year. And that represents a broad range of data sources, with any one university averaging roughly 25 data providers (covering over 70% of the available catalog) and about 110 distinct datasets.
This cross-section shows how professors are reaching into many corners of the data catalog, expressing broad interests beyond what a single-purchase data license could lend.
And that value compounds. If you instead look at the trajectory of the cumulative data downloads for a university’s first year, it’s an average of 10 TB in the first month, 35 TB by 6 months, and over 70 TB across the first full year. And the majority of users are still actively downloading data after the first year.
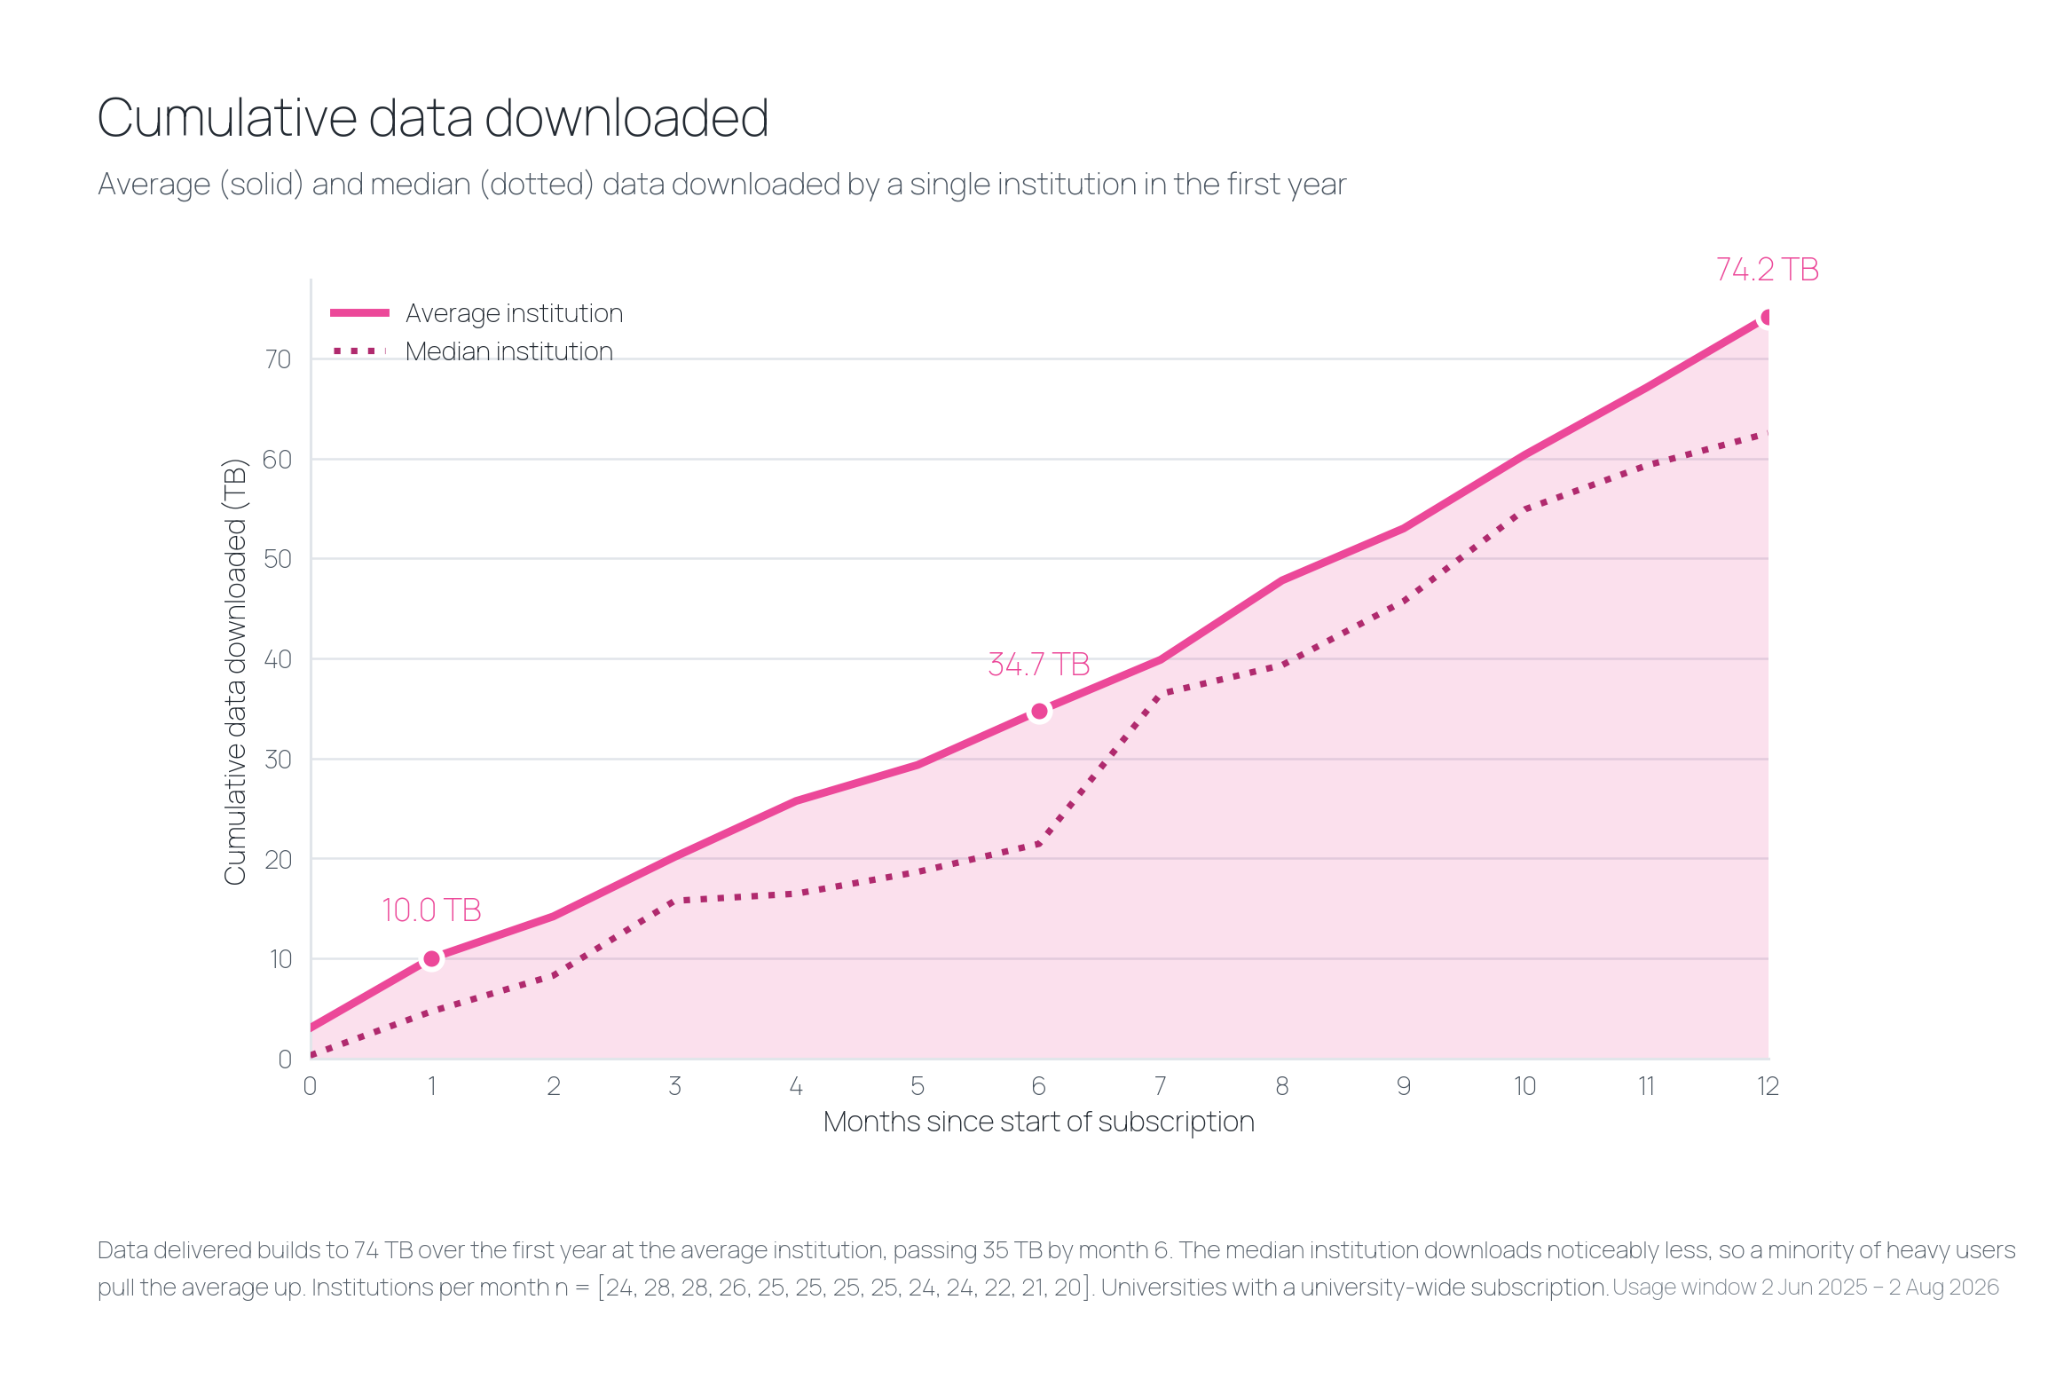
In other words, the one or two interested faculty who justify the initial subscription are usually the start of the story, not the end of it. Word travels, a graduate student picks it up for a project, a colleague in a neighboring department hears about a dataset, and usage broadens from there.
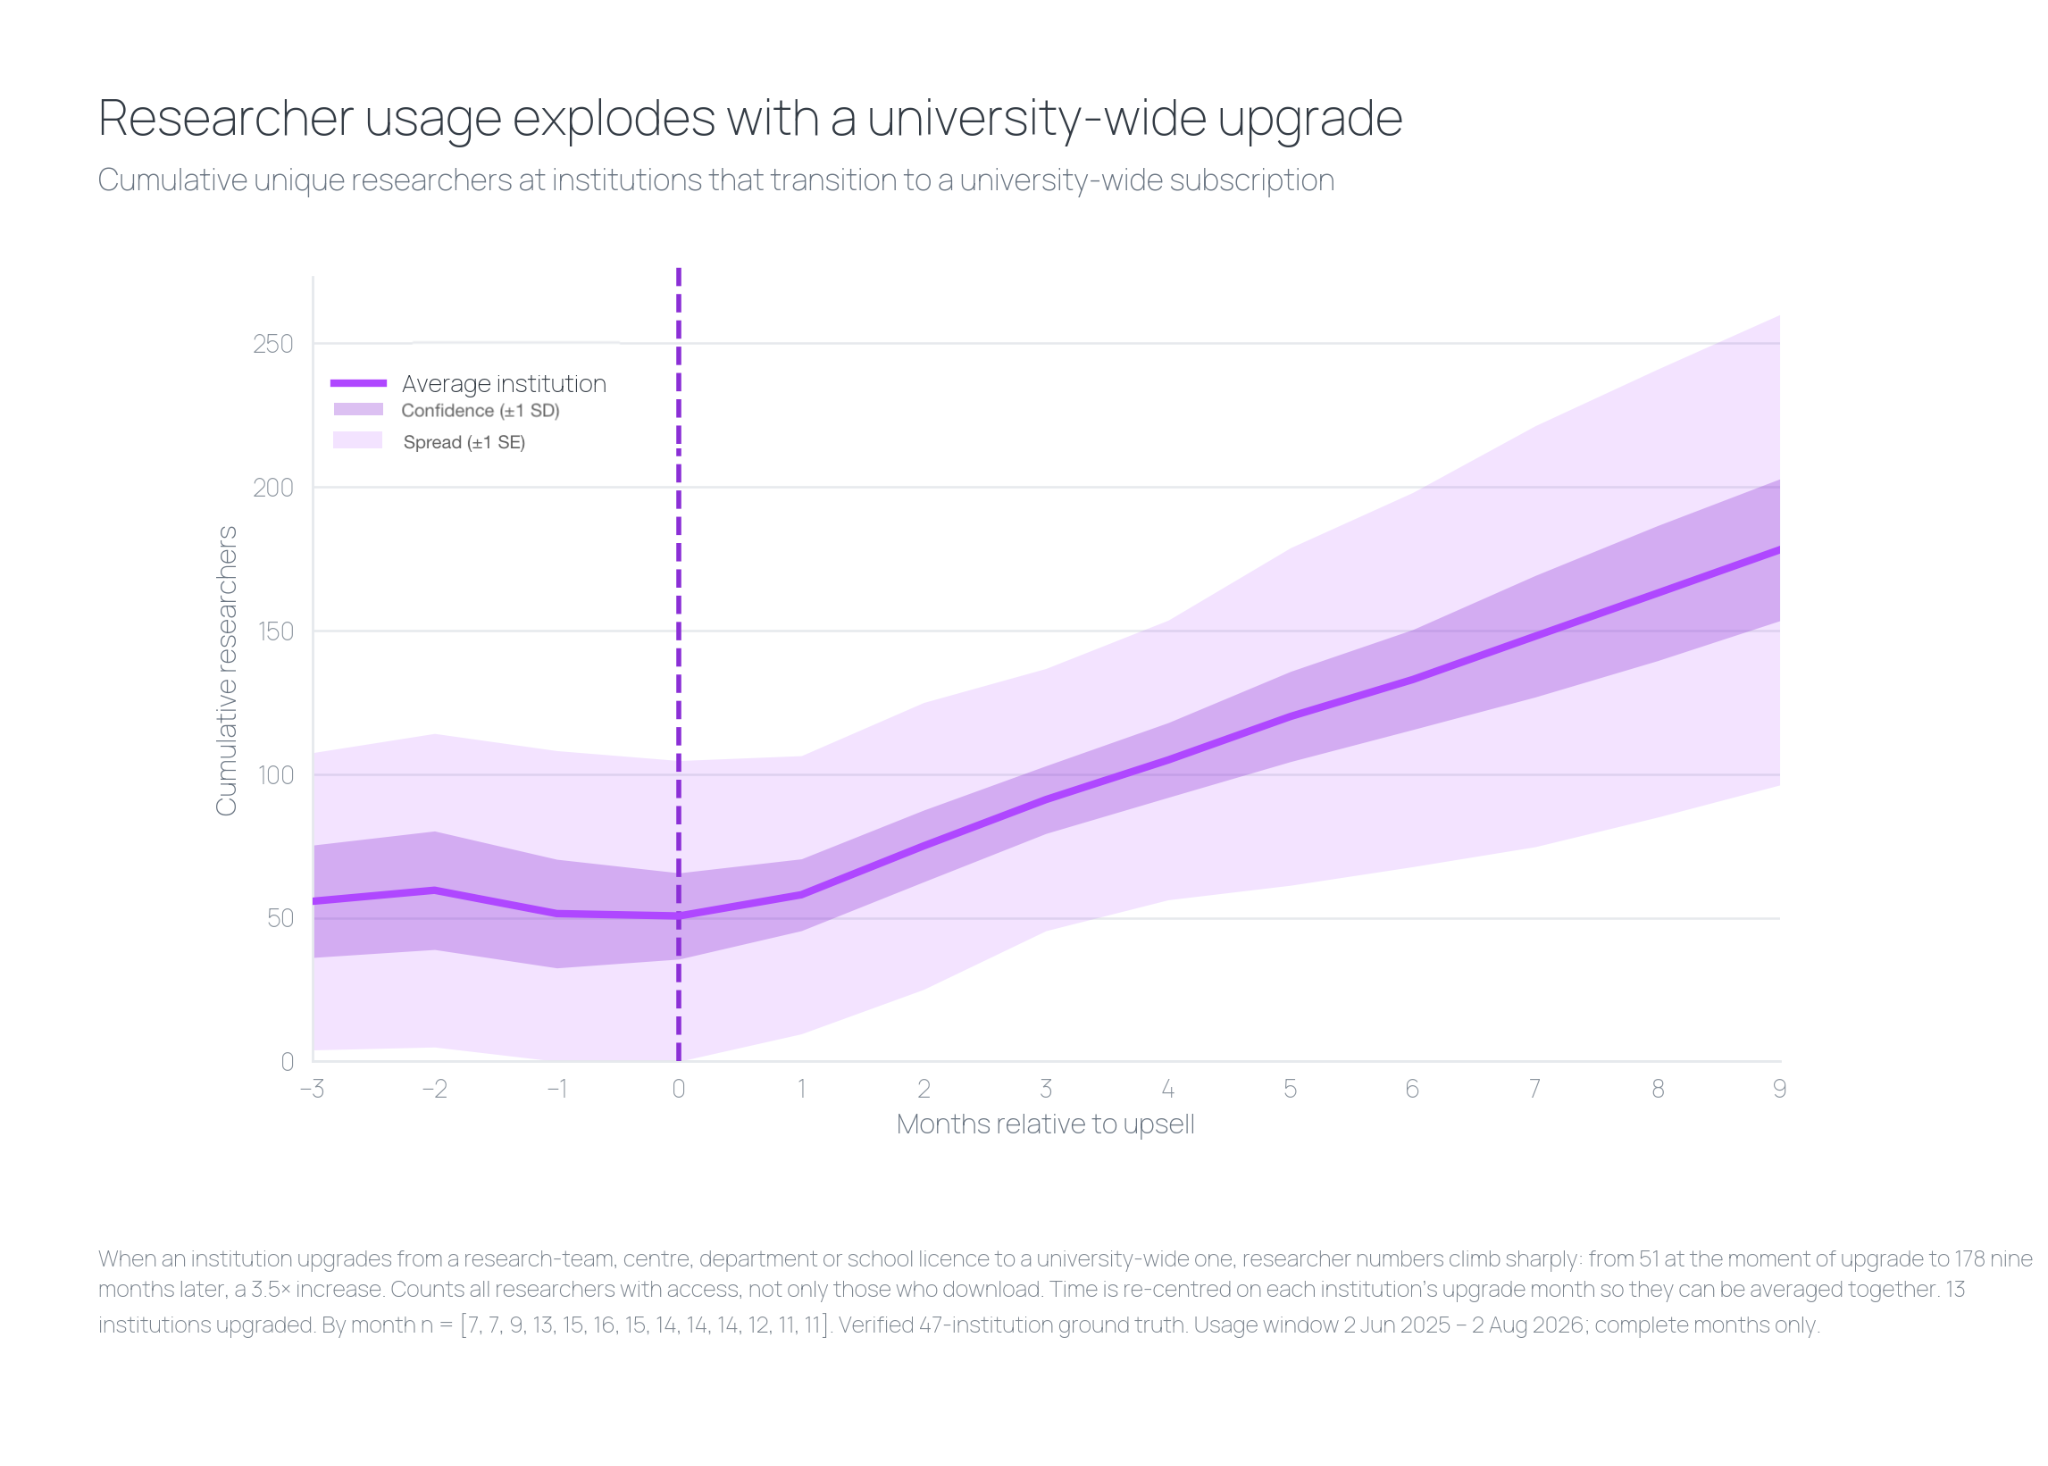
You can especially see this story unfold as universities transition from a departmental subscription to an institutional one.
The rhythm of research: data consumption throughout the academic year
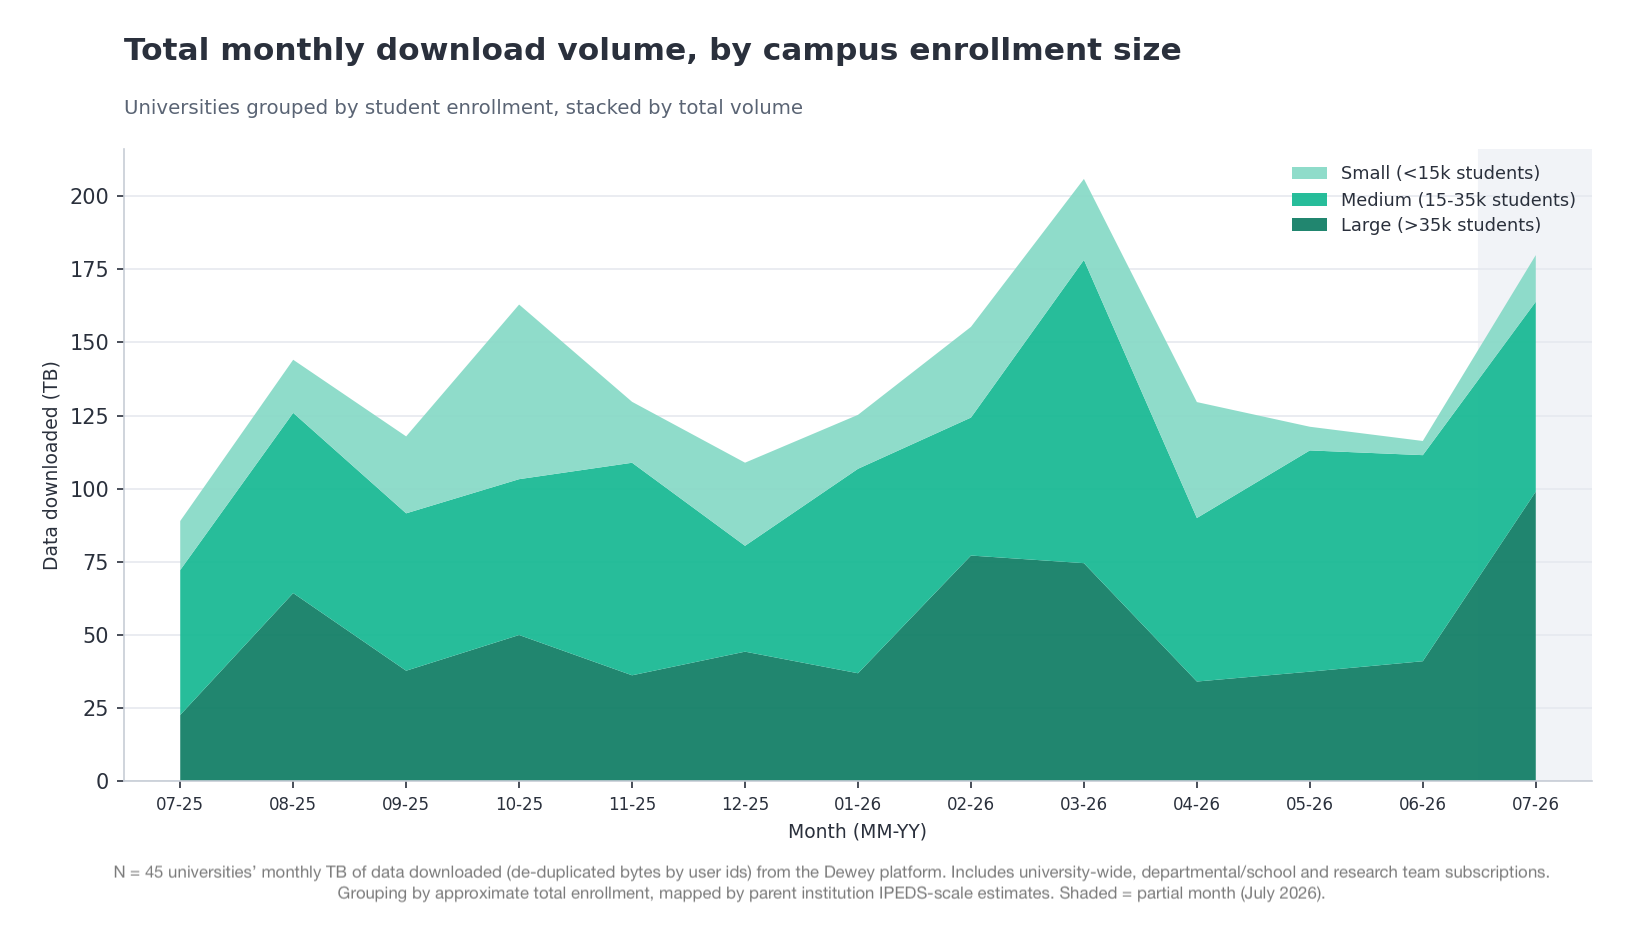
We also see how consumption tracks the academic calendar across universities. From smaller colleges to large R1s, spring term is a new-project sprint, while early summer and winter see a dip in data downloads. And we can already see that researchers are beginning to ramp up in preparation for the new semester right now.
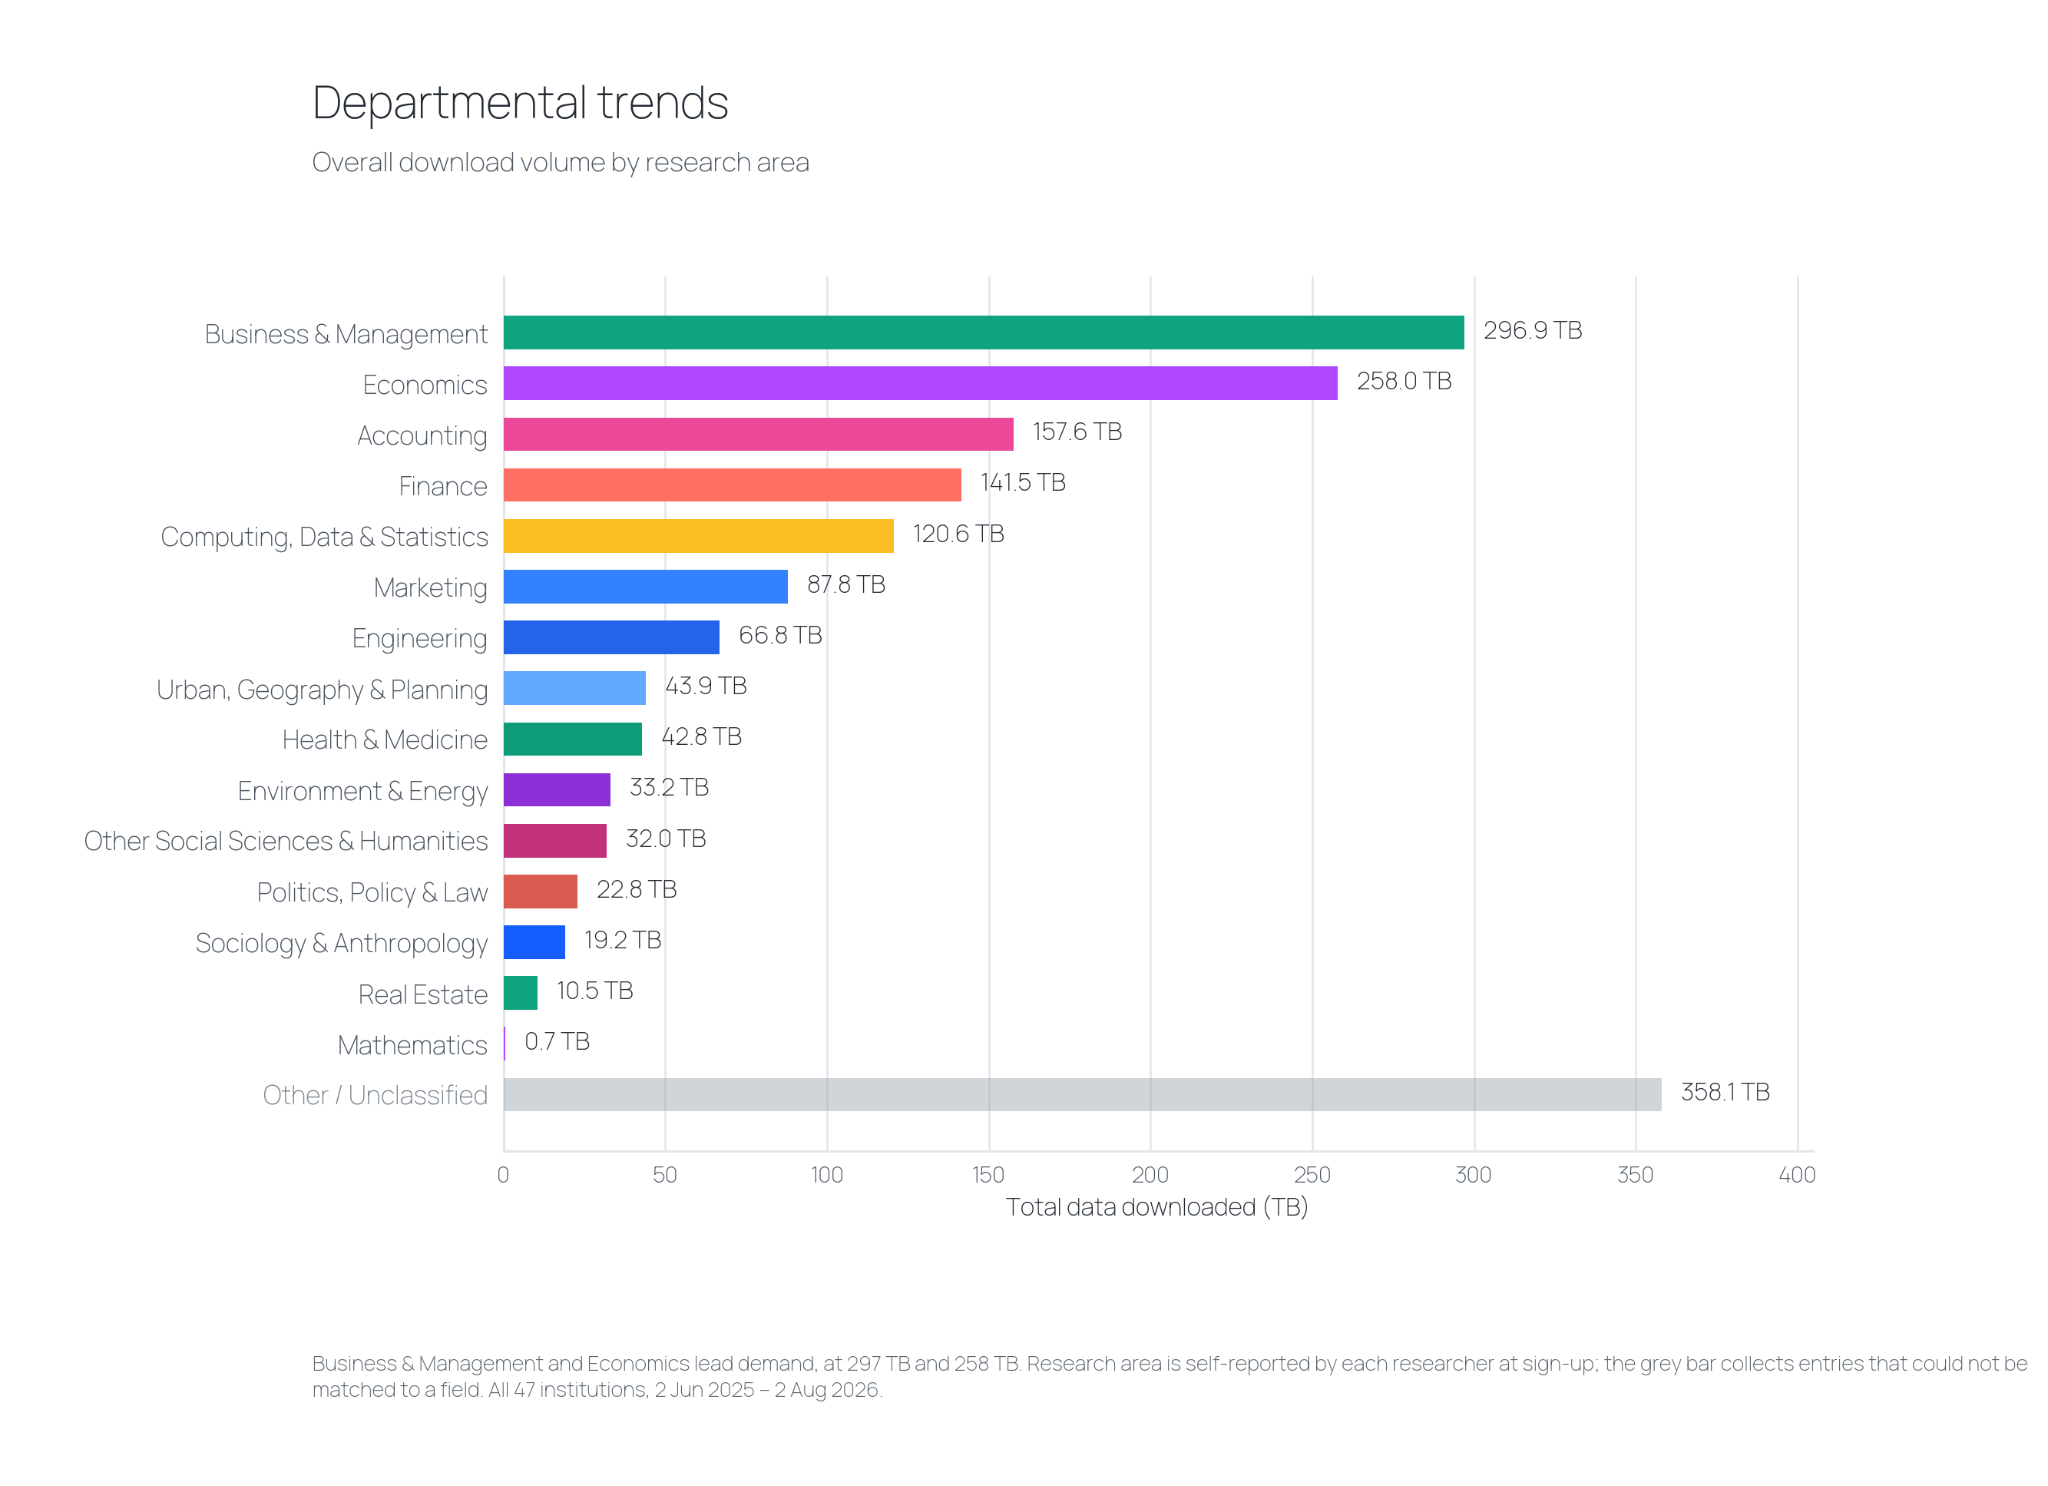
Data downloaded across departments
Business is the largest consuming discipline, but meaningful usage shows up across a wide span of social science and applied fields, including finance, marketing, psychology, public policy, urban and regional planning, geography, public health, and even landscape architecture, among others. Different departments lean on different parts of the catalog, and that variety is a built-in bonus feature. A dataset that is central to a mobility study in urban planning is the same subscription that a marketing researcher and a health economist are drawing on for entirely different questions.
The real unlock is combining datasets
The single most striking thing in the usage data is not how much any one group consumes. It is how many different datasets the most engaged researchers touch.
At the top end, the broadest institutions on the platform draw on more than 200 distinct datasets, and the very broadest reach into the mid-200s. Large, deeply engaged institutions show both scale and intensity, with hundreds of active users each pulling substantial volumes. And new data is being added all the time, increasing the value of your existing subscription. A new data provider draws an average of over 350 downloads in the first month from a single university, and Dewey regularly hosts seminars with data providers to get researchers acquainted with new datasets and examples of the research they can produce.
Being able to easily join and combine sources is something researchers really value: layering foot-traffic data against consumer spending, or linking a labor dataset to a housing dataset to a health outcome. Those are questions no single dataset can answer, and they only become possible when many datasets live under one roof and can be worked together.
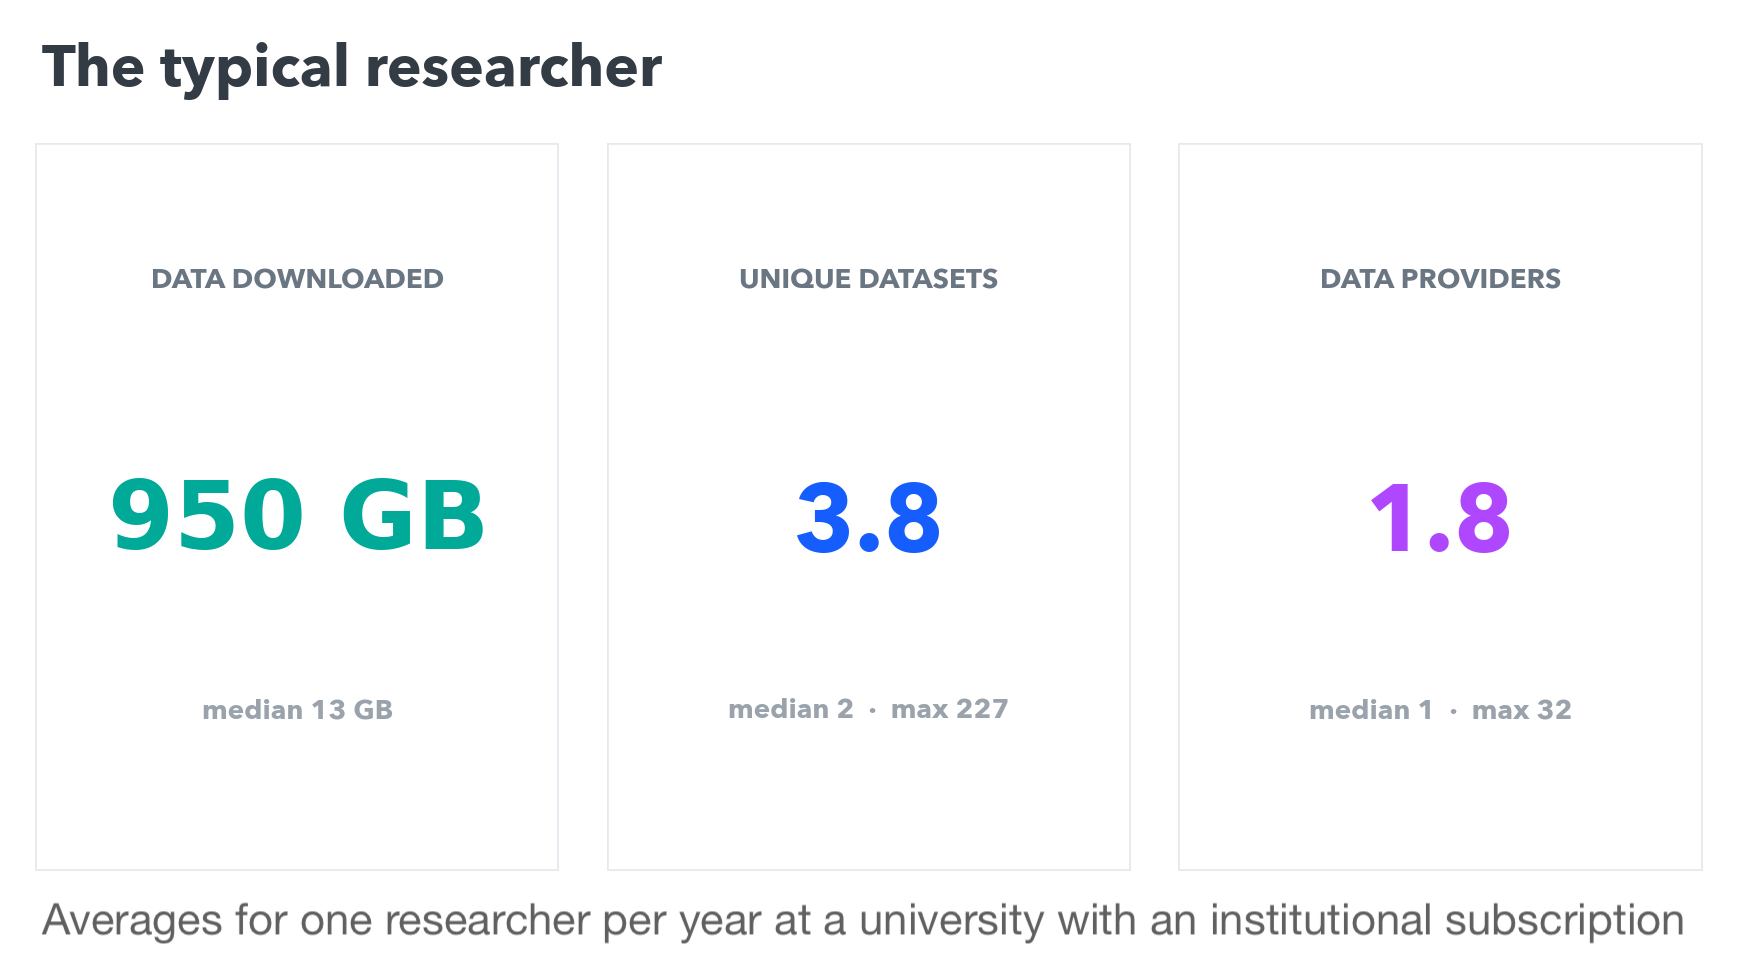
This is where the economics of an institutional subscription really land. A Dewey subscription is often comparable in cost to licensing a single commercial dataset on its own. For roughly that same spend, an institution gets access to hundreds of datasets from dozens of providers for every department. The value is not only the number of datasets. It is the research potential unlocked when those datasets can be joined and combined to ask genuinely new questions.
Exploring the landscape of commercial data for research
To get a better understanding of the commercial data landscape used in academic research, you can explore our 2026 Market Map. We break down data providers by category and access point, and score by publication footprint in a filterable visual and database. If you are weighing whether an institutional subscription makes sense for your campus, browse this map and see which providers and categories line up with what your researchers need. And if you want to talk through what a subscription would look like for your specific mix of departments, we are always happy to have that conversation.
Beyond the value you can see in raw data usage and the powerful potential of working with a variety of different datasets, Dewey is dedicated to supporting happy researching through many avenues. From our active discussion forum to live demos, admin tools and libguide help, our team is always here to answer your questions, offer solutions, and set your university up for success. It’s all about getting your researchers the tools they need so they can focus on the questions that really matter.




.svg)