
ATTOM permit data turns permit paperwork into standardized records of property improvements

ATTOM's Building Permits data, now available to institutional subscribers on the Dewey Platform, records roughly 355 million permits filed with city and county building departments, with work descriptions, job values and fees paid, and filer businesses for both residential and commercial permits. On top of the main permit records file, the supplementary files containing status history and standardized work categories make this data particularly useful for researchers studying housing supply, renovation activity and changes to housing stock.
A building permit is a document a property owner or contractor files with a city or county before work starts. The permit record carries a description of the job, written by whoever filed it, in whatever words that jurisdiction uses. So details about the construction sit with over two thousand separate building departments, each using its own format and vocabulary. ATTOM's Building Permit Classifiers file adds a standardized category to that record: including categories like solar installation, kitchen remodel, ADU, roofing, and 34 others. This consolidated, standardized file allows permit data to be compared, joined, counted, and studied across time and jurisdictions. So researchers can answer questions like how many homes added solar before the federal tax credit expired and where, which neighborhoods are actually adding ADUs, or whether renovation in rental housing follows the same pattern as in owner-occupied homes.

What do federal building permit statistics - such as Census building permit survey reports - leave out?
The latest U.S. Census monthly "New Residential Construction" report, whose permit figures come from the Building Permits Survey, put single-family building permits at the lowest annual rate since March 2023. It is the standard gauge of construction activity, measuring new authorized housing units. But it leaves out a lot from the whole picture.
Census classification guidance tells permit officials to leave out renovations, additions and conversions, along with nonresidential buildings, publicly-owned buildings, farm buildings and separate mechanical, electrical and plumbing permits. Nonresidential collection stopped in 1995, largely because local laws decide what requires a permit, often only above a dollar or square-foot threshold, and those rules vary so greatly across the country that Census stopped collecting those categories.
Renovation is measured elsewhere, but only as spending. Census tracks residential improvements in the Value of Construction Put in Place survey, and Harvard's Leading Indicator of Remodeling Activity puts homeowner improvement spending at $521 billion for early 2026. Both report national dollar totals, and both exclude rental housing.
The American Housing Survey does ask owners what projects they did and when, but it runs biennially, covers owner-occupied households only, and does not identify individual properties. No federal source attaches a type of work to a specific parcel and a date. Researchers who need that have assembled it themselves, jurisdiction by jurisdiction. Therefore, this dataset offers a unified source for residential and commercial permits across jurisdictions.
Building permit classifiers: 38 standardized work categories ready-made for academic research
In ATTOM's Building Permit Classifier table, the variable CLASSIFIER holds one of 38 standardized values. The file has one row per permit per classifier, joined to the permits file on BuildingPermitID.
This offers researchers a clean, standardized, and easily joinable and comparable classification system synthesized from messy, disjointed data. The raw permits file carries more than 400,000 distinct values in its TYPE field and over 100 million distinct free-text descriptions. For example, solar work appears as "Solar," "Electro voltaic," "Roof panels," or "Electrical."
A permit can also carry more than one classification, which are generally grouped into property class, trades, projects, or site work. For example, a residential kitchen remodel that moves a gas line and rewires a circuit would match on each point. Keyword rules force a single choice where applicable: a permit reading "re-roof and install solar" goes to roofing or to solar, depending on the priority order of the base text. Of note for analysis, you cannot sum permits by classifier without handling the overlap.
Typically this has been work researchers do themselves. For example, one recent study used an LLM to classify listing text and benchmarked it against a keyword dictionary, and then validated it against human review. Here now is a research-ready file.
Linking permit records to parcel-level property data
The permits file carries ATTOMID, ATTOM's parcel key, on about 286 million of roughly 355 million permits. It is the same key used by ATTOM's other main datasets, including Tax Assessor, Assessor History, Recorder and Pre-Foreclosure History, also available on the Dewey Platform. A categorized permit becomes a dated event in a property's history, next to its assessed value, sales, mortgages and distress filings. This provides research questions like tracking solar incentives and ADU developments robust context.
Case Study 1: tracking residential solar permits after the 25D credit.
The Section 25D residential clean energy credit, which was a federal tax credit allowing homeowners to claim 30% refunds for installing qualifying renewable energy systems, was ended for systems placed in service after December 31, 2025. The statute keys on installation completion, not contract signing, so the permit record determines whether a household qualified. The solar classifier, a parcel key and a date show who pulled forward into late 2025 and who filed but did not finish. This matters for research on clean energy incentives, where the central questions are whether a credit creates new adoption or simply moves demand earlier, and which households capture it.
Case Study 2: Counting ADU permits without hand-coded keywords
ADU liberalization is one of the most widely adopted state housing reforms of the past decade. Counting ADUs normally means writing a keyword dictionary and defending it. Here they are already a standard category. For housing supply research, the central questions are whether loosening ADU rules actually produces units, how quickly they appear, and on what kinds of parcels.
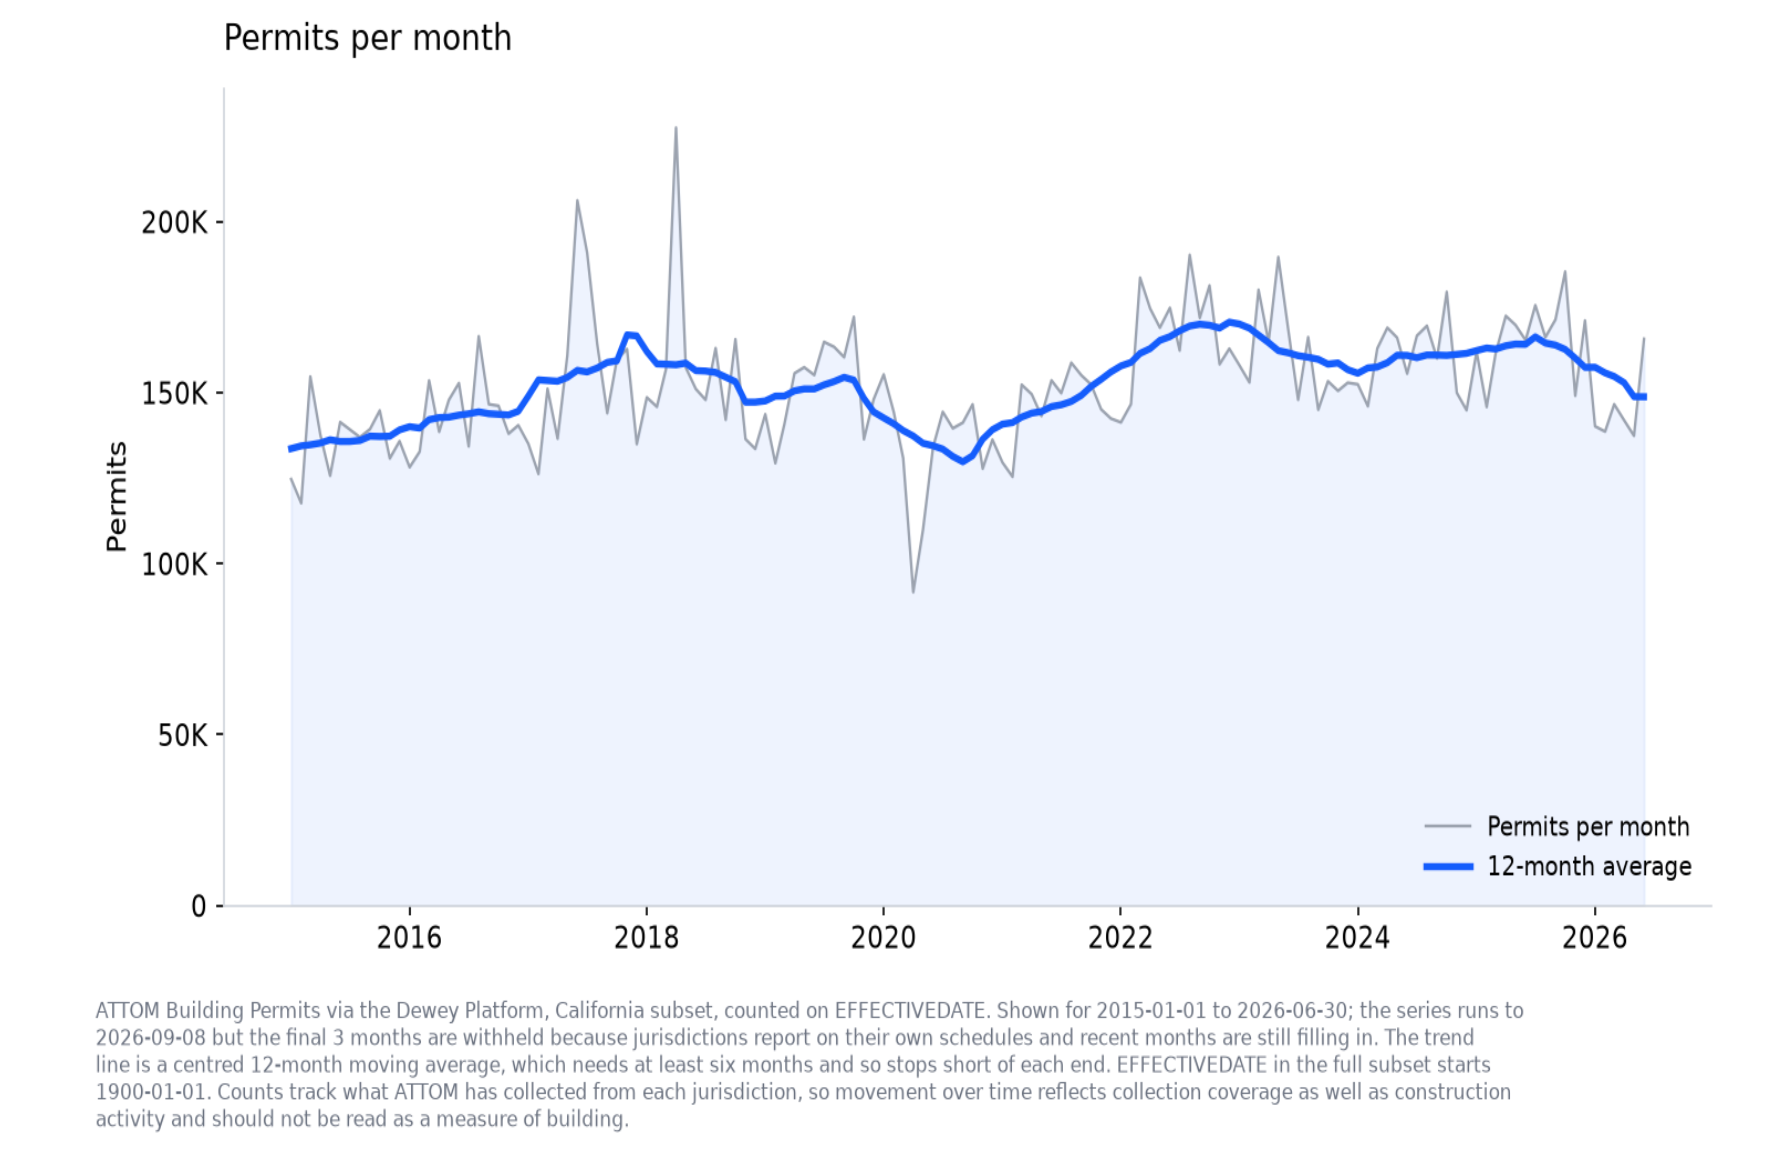
Practical points of permit data for academic researchers
Not every permit has a classifier. The classifiers file covers a subset of the permits file. Check the join rate for your geography and period.
ATTOM uses a proprietary classification method. It describes the approach as machine learning and normalization. Category definitions, training data and accuracy rates are not public.
Standardized descriptions are not standardized permit rules. What triggers a permit still varies by jurisdiction. Comparing one place over time holds those rules constant. Comparing levels across places does not, so a gap between two counties may only reflect a different permit threshold.
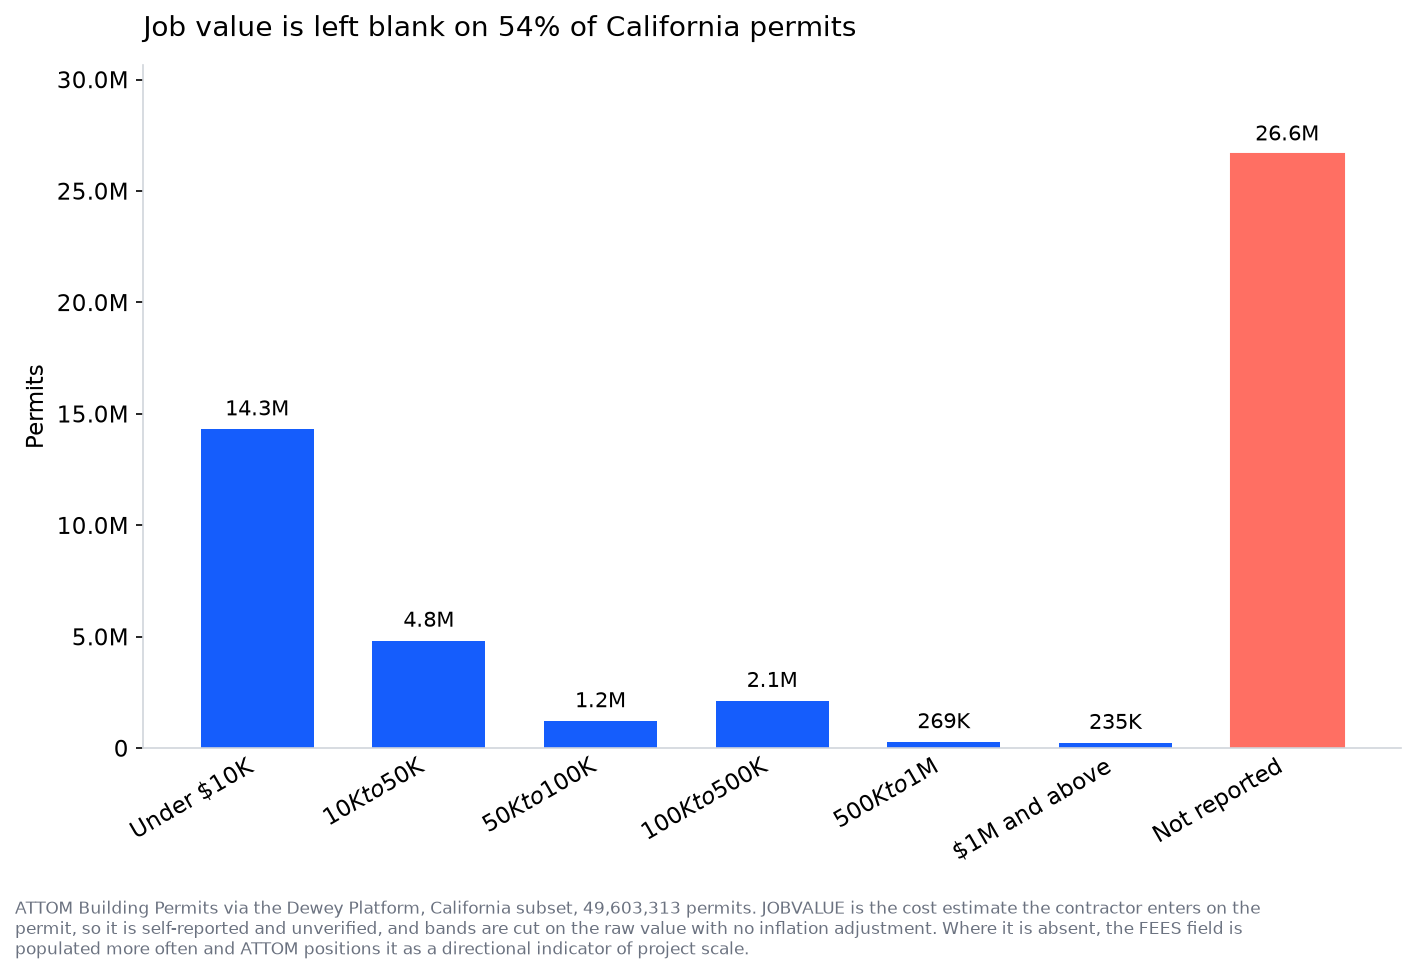
Data coverage can only reflect what is available in the source. Sometimes fields are left blank, as in the visual for job value below; however, these can often be approximated from other variables such as FEES.
Research inspiration and project ideas for ATTOM’s permit data
Joined on BuildingPermitID, classifiers can be joined to building permit Statuses (15 standardized stages and dates), Business name (with over 19 million permit requesters), FEES and JOBVALUE, providing researchers with rich context to investigate.
To start, ATTOM's property data already supports published housing research, mostly through the assessor and recorder files. Jaehee Song's Unpacking Housing Supply Constraints: Zoning Regulations and Hidden Barriers (2026) estimates implicit regulatory barriers at roughly $117,000 per project in Greater Boston. Richard Stanton, Nancy Wallace, Paulo Issler and Yao Zhao forecast California wildfire risk (2025) using property-level data.
Research questions permit categories open up & what dataset pairings unlock
- Economic impacts. How does renovation respond to interest rate shocks, separately from new construction? Pair with InfutorData or EDI to track financial impacts.
- Growth and development. Does demolition activity predict redevelopment, and how far ahead?
- Local demand. Can trade-specific permit volume proxy for local construction labor demand?
- Permits and rents. Pair renovation classifiers with listings from Dwellsy or RentHub. Federal improvement measures exclude rental properties, so this is open ground.
- Climate adaptation. Join roofing and solar classifiers to ClimateCheck's property-level risk scores.
- Contractor dynamics. Match permit requestor names to BrightQuery or Data Axle firmographics to study firm entry, exit and reach.
Resources
- Building Permits on the Dewey Platform
- Building Permits documentation
- ATTOM Data permits documentation
Dataset citation: ATTOM Data. (2026). Building Permits (Version 1.1) [Data set]. Dewey Data. https://doi.org/10.82551/76TC-WX15
References
- U.S. Census Bureau, New Residential Construction, September 2026
- U.S. Census Bureau, Building Permits Survey methodology
- U.S. Census Bureau, Building Permits Survey classification FAQs
- U.S. Census Bureau, Building Permits Survey general FAQs
- U.S. Census Bureau, Building Permits Survey sample files and documentation
- U.S. Census Bureau, Does the American Housing Survey collect data on remodeling?
- U.S. Census Bureau, Value of Private Construction Put in Place
- Joint Center for Housing Studies of Harvard University, Leading Indicator of Remodeling Activity
- ATTOM, Building Permits documentation
- ATTOM, Nationwide building permit data
- Soltas, E., & Gruber, J. (2026). How Costly Is Permitting in Housing Development? Griswold Center for Economic Policy Studies Working Paper 352.
- Solar Power World, How does HR1 change the residential solar ITC?
- Song, J. (2026). Unpacking Housing Supply Constraints: Zoning Regulations and Hidden Barriers.
- Stanton, R., Wallace, N., Issler, P., & Zhao, Y. (2025). Measuring the wildfire risk of California real estate with spatiotemporal convolutional neural networks.
#AcademicResearch #HousingResearch #RealEstateEconomics #UrbanEconomics #DataForResearch


