.svg)
Write It, run It, share it: A marimo workflow with TenderAlpha's Green Procurement Data

This post walks through an analysis of TenderAlpha's Green Government Contract Awards data using marimo, a reactive, open-source Python notebook that makes reproducible workflows easy. Check out the capabilities of this analytic tool while exploring the research possibilities of green score variables, complete with sample code, data visualizations, and inspiration for your use cases.
The Dataset
TenderAlpha's Green Government Contract Awards dataset tracks green public procurement (GPP) across 27 countries from 2010 to now. Every record represents a government contract award that has been classified as "green" based on TenderAlpha's proprietary 3-pillar methodology — evaluating eco-legislation and regulations, environmental impact reduction, and sustainability standards.
The dataset covers 4.5 million US contracts alone, with meaningful coverage across the EU, UK, Canada, Japan, South Korea, and Australia. It is delivered as Parquet files via the Dewey bulk API.
Two variables are at the center of this analysis:
- GREEN_SCORE is a continuous score from 0 to 100 assigned to each contract, reflecting the degree of environmental responsibility in the procurement. Higher scores indicate more comprehensively “green” contracts. Averaged across all contracts for a given country and year, it becomes a useful proxy for the ambition and consistency of a government's green procurement activity over time.
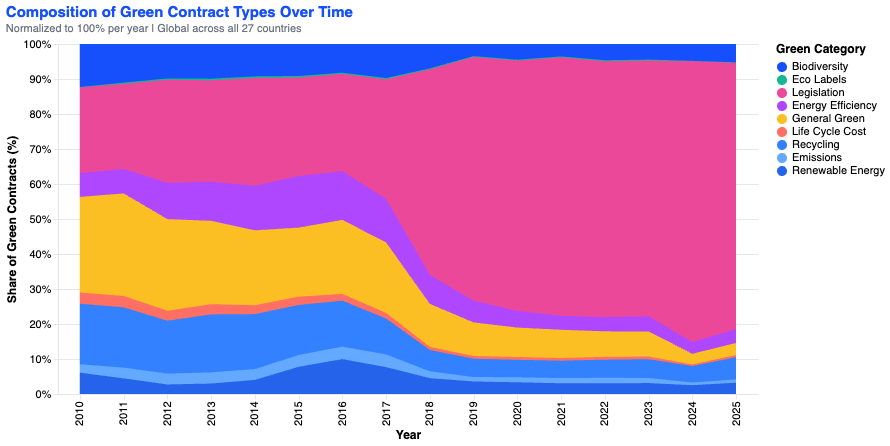
- The nine GREEN_CATEGORY_* binary columns classify each contract into one or more green procurement types: Renewable Energy, Energy Efficiency, Reduced Emissions, Recycling, Eco Labels, Eco-Legislature, Biodiversity, Life Cycle Cost, and General Green. A single contract can belong to multiple categories. Together, these columns let researchers track not just whether a government is procuring green, but what kind of green — and how that composition shifts in response to policy changes, economic pressures, or international commitments.
Analysis workflow with marimo
Why marimo?
While I simply couldn’t miss the opportunity to analyze green scores with a notebook named for an algae, marimo also has some researcher workflow benefits worth highlighting. Most Python notebooks are linear documents: you run cells top to bottom, the outputs sit below the code, and if something upstream changes, you remember (or forget) to re-run what depends on it. That works fine for a quick exploration, but it creates friction for analyses you want to share, revisit, or hand off.
marimo takes a different approach. It's an open-source reactive Python notebook, originally built by scientists at Stanford's SLAC National Accelerator Laboratory, designed with reproducibility and shareability as first-class goals.
A few things set it apart that are particularly relevant for research workflows:
♻️ Reactive execution. marimo tracks variable dependencies across cells. When a cell runs, any cell that depends on its outputs is automatically marked as stale and re-executed. This means you don't have to manage execution order manually, and there's no hidden state accumulating in memory.
🔆 UI widgets as part of the notebook. marimo includes built-in interactive elements — multiselects, sliders, dropdowns — that connect directly to Python. When a user changes a widget value, the affected cells re-run automatically. This isn't a separate dashboard layer; the interactivity is built into the same file as the analysis.
🐍 Plain .py file format. A marimo notebook is a standard Python file, not a JSON blob. That means it's readable as code, version-controllable with Git, diff-able in a pull request, testable with pytest, and importable as a module. For researchers managing code across a lab or collaborating on a shared repository, this is a meaningful practical difference.
✅ One command to share. Running ‘marimo run notebook.py’ spins up a web app from the notebook file. No separate framework, no export step. A collaborator, reviewer, or student can interact with the analysis in a browser without seeing or touching the code.
To install:
pip install marimoThen open a notebook:
marimo edit your_notebook.pyOr run it as an app:
marimo run your_notebook.py
Full Workflow
The full notebook (green_score_analysis.py) covers data loading, cleaning, interactive filtering, and visualization across roughly 20 cells. Here's how the key pieces fit together.
Loading Parquet with PyArrow
The dataset arrives as Parquet files. Rather than reading everything into memory, the notebook uses PyArrow to select only the columns needed and cast types efficiently at load time — decimal columns to float32, the country column to a dictionary-encoded categorical. On a dataset this size, column selection alone cuts memory use significantly.
cols_needed = [DATE, COUNTRY, SCORE] + GREEN_CATS
dataset = pq.ParquetDataset(DATA_DIR)
table = dataset.read(columns=cols_needed)
This snippet is reusable for any Dewey Parquet dataset — swap in the path and column list for your own data.
Reactive UI Widgets
The notebook uses mo.ui.multiselect to let users filter by region, country, and green category. Each widget is defined in its own cell and rendered inline:
region_picker = mo.ui.multiselect(
    label="Filter by region",
    options=["Europe", "North America", "Asia-Pacific"],
    value=["Europe", "North America", "Asia-Pacific"],
)
region_picker
Because marimo tracks dependencies, any cell that references region_picker.value automatically re-runs when the selection changes. There's no callback function to write, no event handler to wire up. The interactivity follows from the structure of the code.
Reactive Filtering
Downstream cells reference the widget values directly. Here's the pattern for propagating a region selection into a country filter:
countries_in_region = [
    code for code, group in COUNTRY_GROUPS.items()
    if group in region_picker.value
]
country_picker = mo.ui.multiselect(
    label="Select countries",
    options=sorted(countries_in_region),
    value=sorted(countries_in_region),
)
When the region picker changes, this cell re-runs, which updates the country picker, which re-runs the filtering cell, which re-runs the charts. The entire pipeline stays in sync without any manual orchestration.
Altair Charts via mo.ui.altair_chart()Wrapping an Altair chart in mo.ui.altair_chart() makes it interactive — selections in the chart are returned to Python as a filtered dataframe, which can feed downstream cells.
chart_lines = mo.ui.altair_chart(
    alt.Chart(df_filtered)
    .mark_line(point=True, strokeWidth=2.5)
    .encode(
        x=alt.X("year:O", title="Year"),
        y=alt.Y("avg_score:Q", title="Avg Green Score"),
        color=alt.Color("country:N"),
        tooltip=[...],
    )
)
chart_lines
The notebook produces two main charts: a line chart of average GREEN_SCORE by country from 2010–2025, and a stacked area chart showing how the composition of green contract categories has shifted globally over time.
Research Inspiration
A few ideas for directions worth exploring with this dataset:
Green Share % (Company Supplement feed): Normalize by total procurement activity per firm to compare ESG credibility across companies.
Policy event studies. TenderAlpha includes tender_date_of_award at the contract level. Joining that to known policy dates lets you test whether legislative announcements translate into measurable shifts in contract award volume or average green score.
Greenwashing and ESG signal research. The dataset includes awardee_parent_ticker_symbol, making it possible to link green contract activity to public equity data. A natural research question: do companies with high green contract share trade at a premium relative to their ESG agency ratings? Or does high GPP exposure correlate with low disclosed ESG scores, suggesting a measurement gap? Pairing TenderAlpha with financial data available on the Dewey Platform could support event studies around contract award dates.
Cross-country procurement convergence. Are developed economies converging on similar green procurement standards, or are the gaps widening? Pairing TenderAlpha's GREEN_SCORE trends with macroeconomic or trade data available on Dewey (for example, BrightQuery occupational wage data or Estimize’s Economic Indicators) would let researchers situate procurement behavior in broader economic context and test whether higher-wage economies systematically procure greener contracts.
Resources:
- TenderAlpha's Green Government Contract Awards dataset – available on Dewey
- LinkedIn Article Series on unique data attributes – highlighting the unique value add of green scores for research
- green_score_analysis.py: Downloadable python script for the marimo notebook used in this guide. Swap in your own data and run it yourself.
- marimo documentation
- marimo for researchers


.svg)