.svg)

Below is a walkthrough analyzing apartment rent prices in NYC in 2025, built on Dwellsy TotalIQ dataset, including a ready-to-run Python script, key findings, and research ideas for pairing Dwellsy with other Dewey datasets.
What sets Dwellsy apart?
Now available on Dewey, Dwellsy TotalIQ dataset offers unique insights into rent trends. It is built directly from property management systems, capturing how the rental market actually operates. Three things set it apart:
- First-party sourcing: Every data point originates from systems of record where rents are set, updated, and finalized Dewey Docs
- Scale & coverage: 17M+ listings across 16,000+ ZIP codes and 800+ MSAs, with history back to 2020 Dwellsy
- Unit-level precision: 250+ standardized attributes per listing,including rent pricing, listing history, and time on market, updated continuously Dwellsy IQ
Crucially, it captures the full price discovery arc for each unit: every price update from first listing to final asking rent, which is the price ~95% of leases are actually signed at. For researchers studying housing affordability, shelter CPI, or rental market dynamics, this is the data infrastructure the field has been waiting for.
The Dataset: Dwellsy TotalIQ
Dwellsy TotalIQ is a comprehensive U.S. residential rental listings dataset. Key fields include asking rent, bedroom count, ZIP code, a persistent property identifier, and listing creation timestamps, giving researchers the raw material for both market-level benchmarking and individual property tracking.
Key capabilities
- Millions of U.S. rental listings with timestamps and persistent property IDs
- PROPERTY_ID : a unit-level identifier enabling repeat-observation, within-unit price analysis
- ZIP code geography : map to any custom submarket, borough, or metro with a simple SQL CASE statement
- Delivered as Parquet via the Dewey bulk API : query instantly with DuckDB, no infrastructure needed
Analysis 1: Borough Market Benchmarks
Filtering by ZIP code ranges maps Dwellsy records directly to NYC boroughs, no external crosswalk file needed. The script uses a DuckDB CASE statement to assign Manhattan, Brooklyn, and Queens based on standard five-digit ZIP ranges, with TRY_CAST handling any malformed ZIP+4 values gracefully.
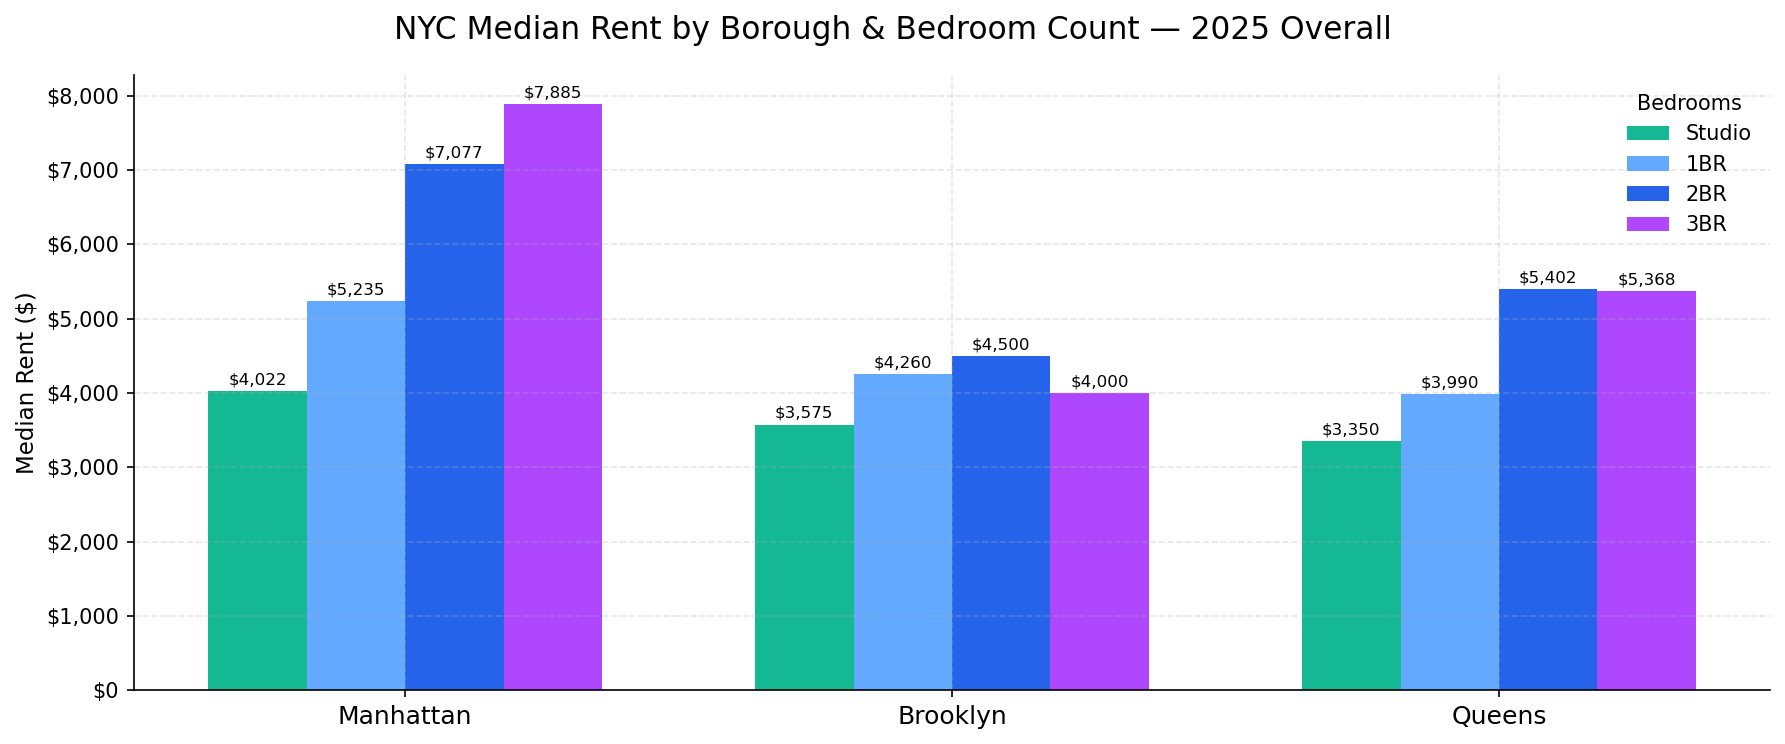
Key finding: Manhattan 2BR median ($7,077) is 57% above Brooklyn ($4,500) and 31% above Queens ($5,402). Studios show the smallest borough gap — useful for demand elasticity research.
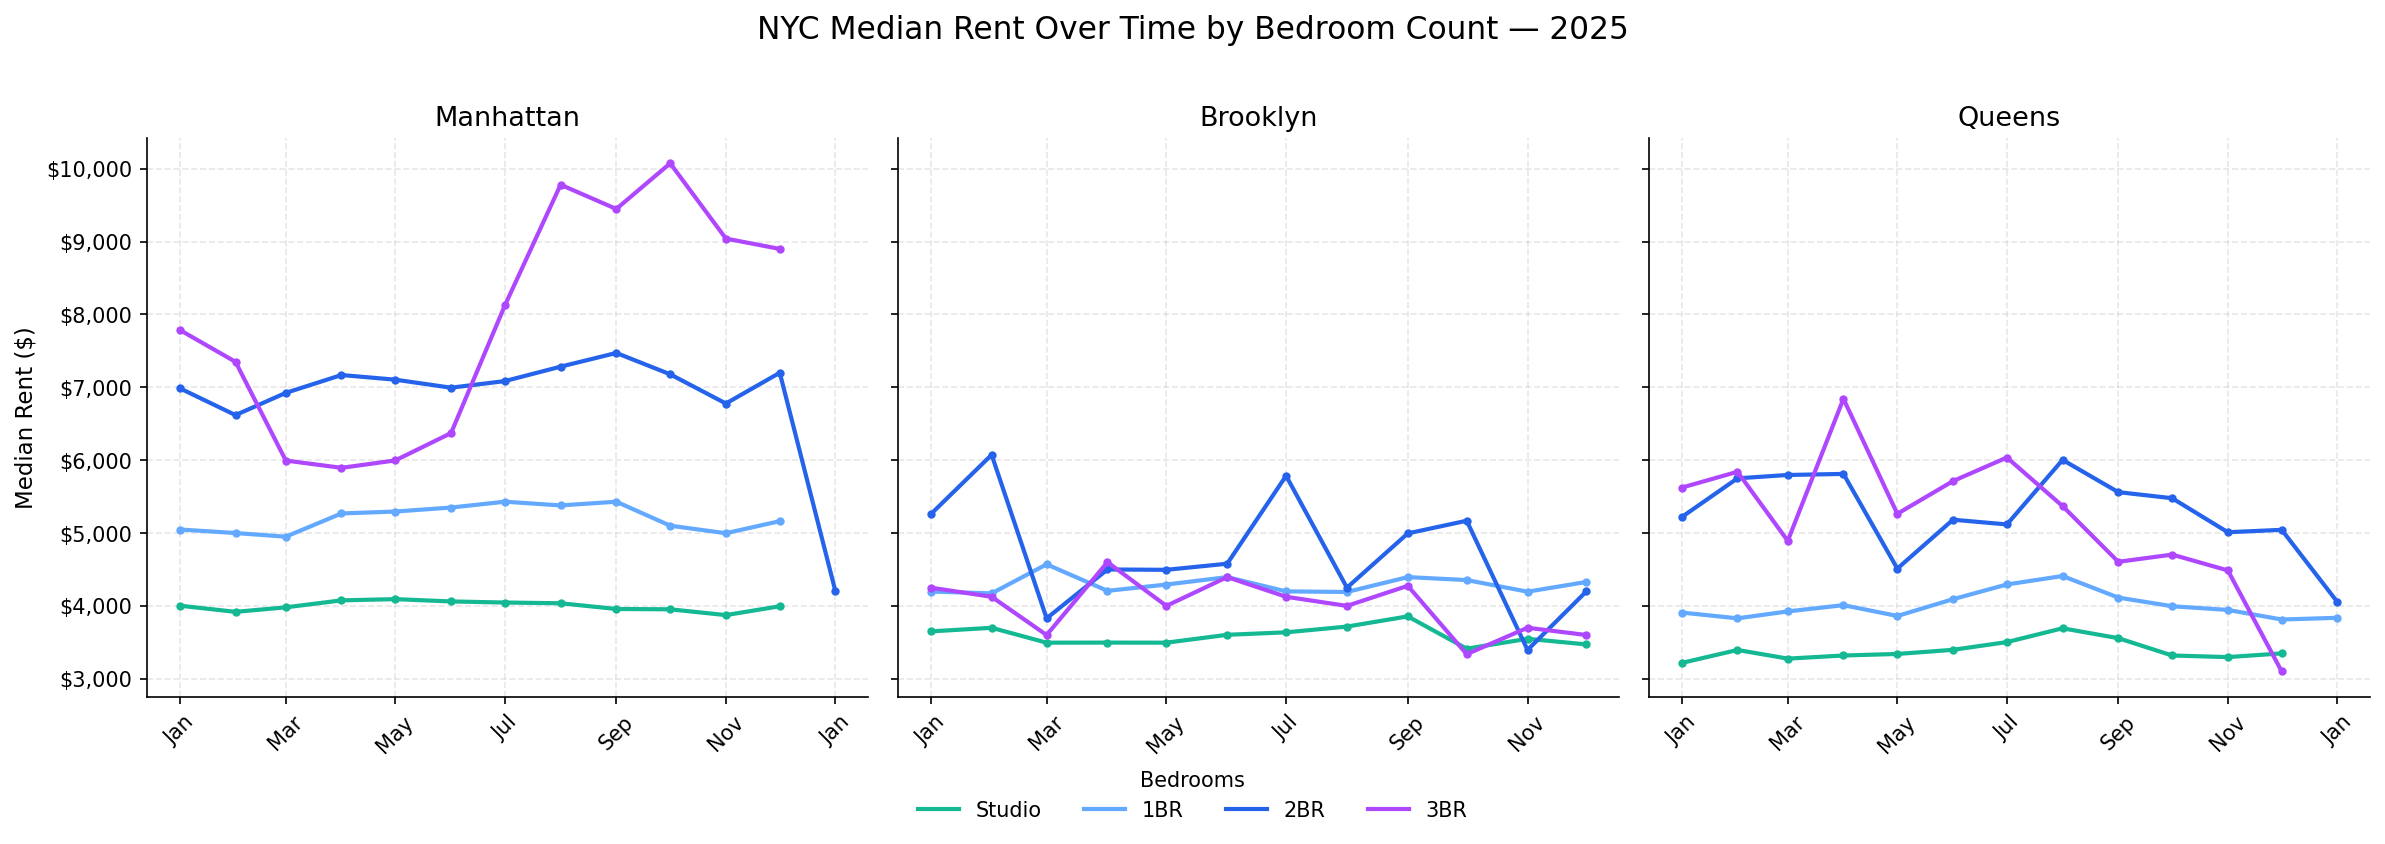
Monthly time-series trends show stability in Studios and 1BRs throughout 2025, while Manhattan 3BR asking rents spike sharply through summer — consistent with family-unit seasonal demand.
Analysis 2: Within-Unit Price Tracking
The key capability: repeat-property observations
Dwellsy assigns a persistent PROPERTY_ID to each unit. When the same unit appears multiple times in the dataset across different dates (trackable with CREATION_TS), those observations chain together into a price history with no external matching or record linkage required. This is what distinguishes a listings dataset from a true price panel.
Why this matters: Standard rent indices measure market-level medians. PROPERTY_ID enables within-unit price change, days-on-market trajectories, and seasonal asking-rent arcs, the kind of landlord behavior data that aggregate indices can't capture.
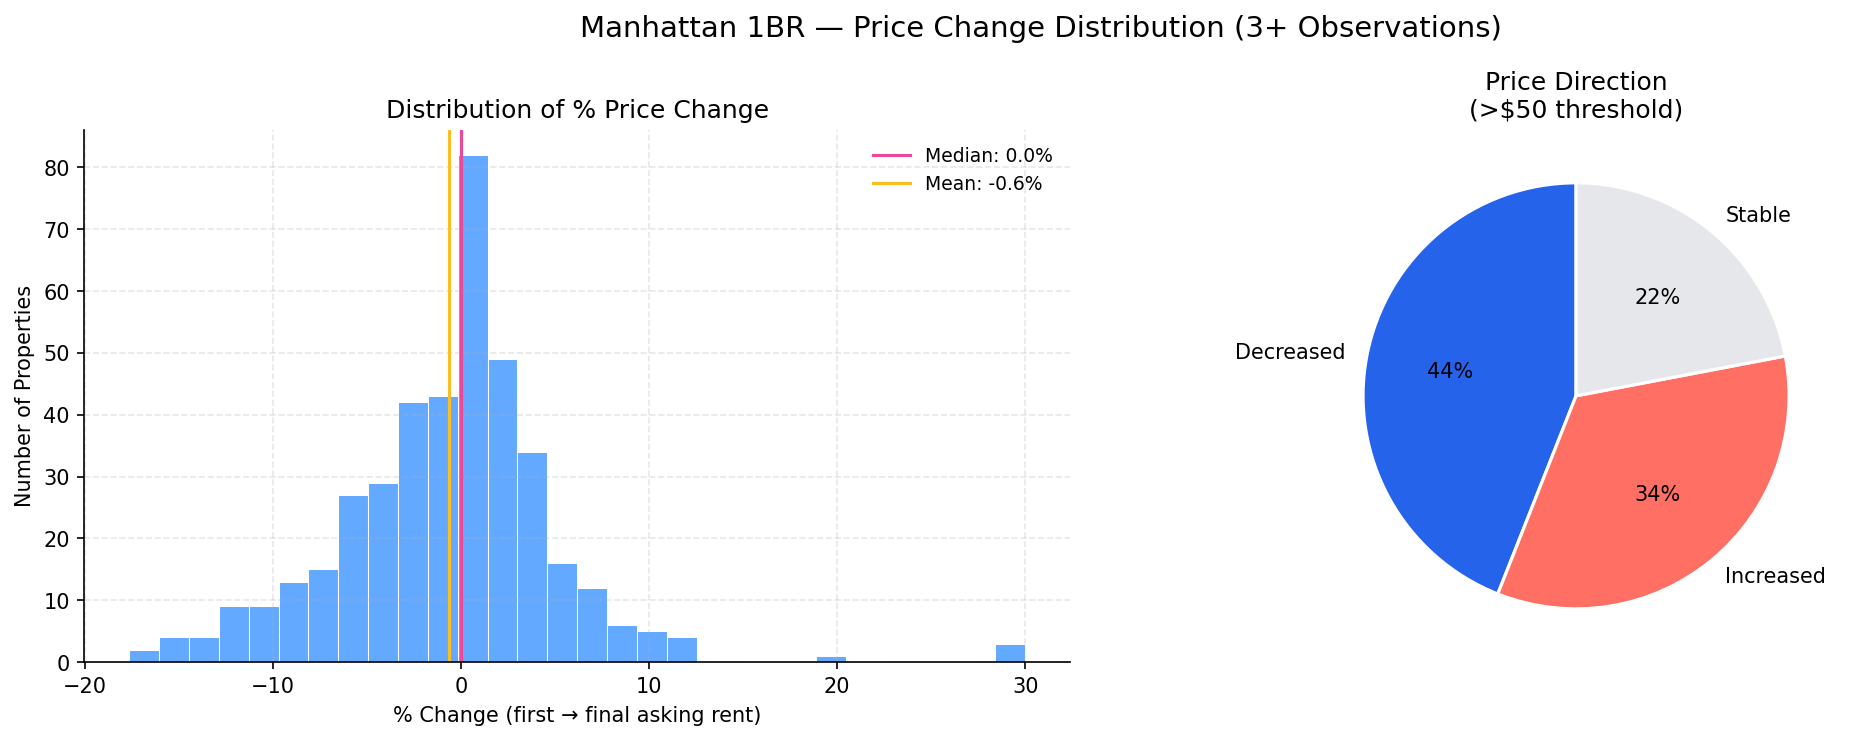
For Manhattan 1BRs with 3+ observations (n = 409 properties), the findings are notable:
- 44% of units ultimately reduced their asking rent
- 34% raised it; 22% remained stable (using a >$50 threshold to filter noise)
- The distribution clusters tightly around 0%, with a median price change of exactly 0.0%
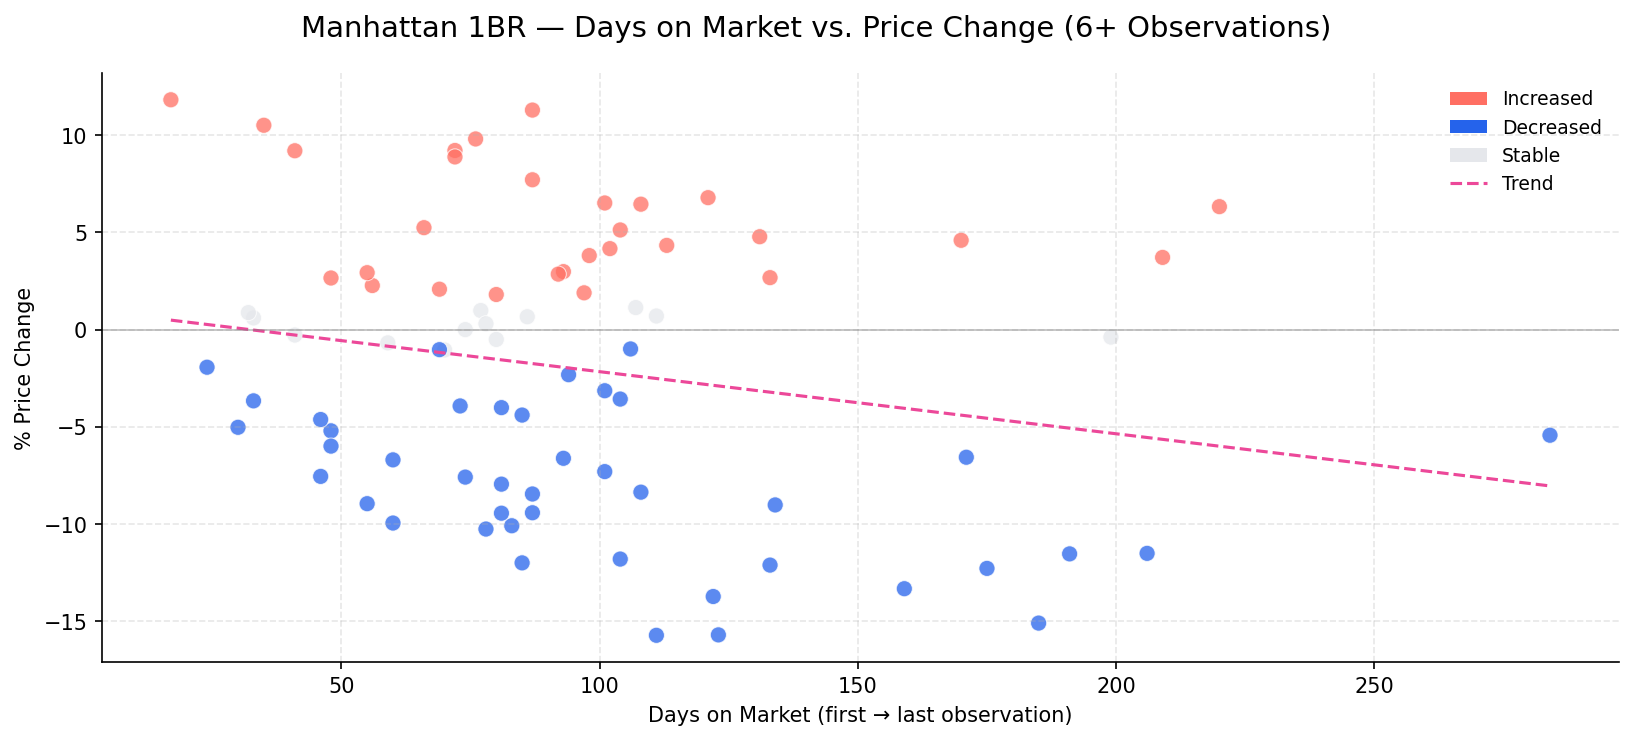
Among properties with 6+ observations (n = 84), a clear negative trend emerges: longer days-on-market correlates with larger price cuts. The linear trendline slopes downward, suggesting landlords listing above market systematically reduce price as time on market increases.
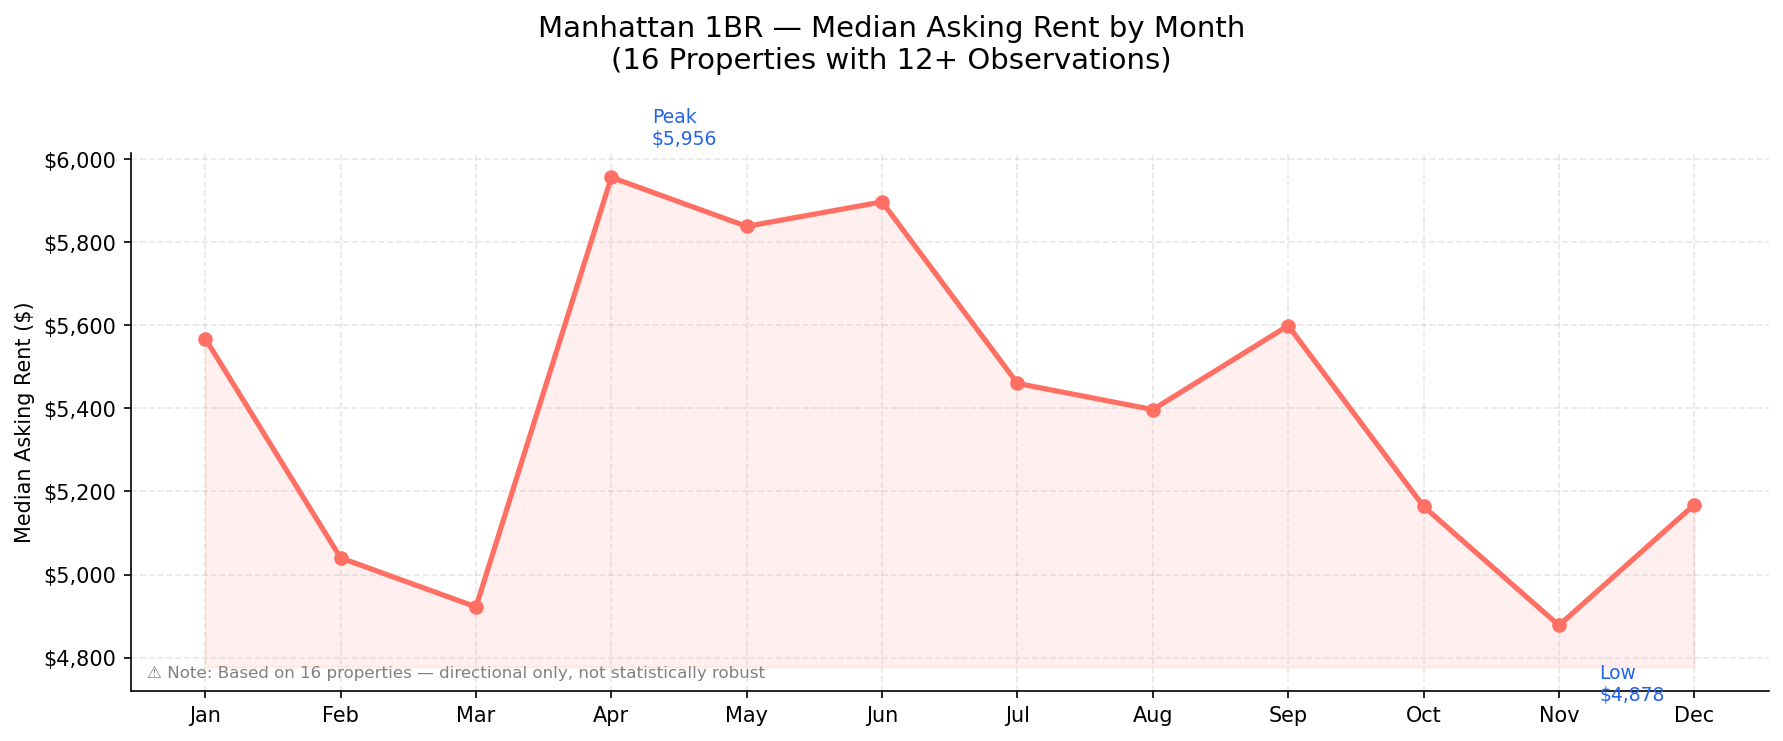
For the 16 properties tracked across 12+ months, asking rent peaks in April at $5,956 and troughs in November at $4,878 — confirming the classic NYC spring leasing surge in unit-level data. Note: treat as directional given the small sample.
Try it yourself: ready-to-run Python script
The full Python script is available to download and run yourself here, and includes ZIP-to-borough mapping, repeat-property panel construction, and all five charts, and annotations. Uses DuckDB, pandas, matplotlib, and numpy.
COMING SOON
Dwellsy TrendsIQ — Precomputed market-level rent indices arriving on Dewey soon. If TotalIQ is the raw listing panel, TrendsIQ delivers the aggregated signal out of the box: metro-level rent trends, vacancy proxies, and seasonal indices, ideal for researchers who want the market view without building the aggregation pipeline themselves. Reach out to [email protected] to be notified when this data is available!
Adopt this workflow to your research
Understanding Dwellsy’s ID Variables
This guide uses PROPERTY_ID (manager × listing) + CREATION_TS to track how a single manager adjusts rent during a listing arc. But Dwellsy's structure supports other approaches depending on your research question:
- PROPERTY_ID — Manager's listing-level pricing decisions. Changes if management changes. Use for: pricing strategy within a single listing episode (this guide's approach).
- DWELLSY_ADDRESS_ID — The physical unit itself, persisting across all managers. Use for: rent history of a unit over years, cross-management comparisons, unit-level long-term trends.
- ADDRESS1_ID — The building/address block. Use for: building-level aggregation, hedonic analysis within a property.
CREATION_TS is the temporal backbone in all cases — order by it to reconstruct sequences, group by it to build time-series.
Choose the ID that matches your unit of analysis. The full Python script demonstrates PROPERTY_ID + CREATION_TS; adapt the GROUP BY and ORDER BY clauses for alternative designs.
Going Further: pairing Dwellsy with other Dewey datasets
Dwellsy's unit-level geography and timestamped observations make it a natural base for cross-dataset research. All datasets below are available with a Dewey subscription (see our pricing page for more details).
- Urban Planning & Urban Economics: Advan Research Weekly Patterns Plus
- Do neighborhoods with rising foot traffic command higher asking rents? How quickly do new amenities capitalize into unit prices?
- Housing Supply: ATTOM Data Recorder / Pre-Foreclosure History
- Does new supply depress rents in nearby ZIP codes? Track asking rent response to deed transfers and construction activity at the submarket level.
- Labor / Housing: LinkUp Job Records
- Do ZIP codes with surging remote-work job postings show different rent trajectories than those dominated by in-person roles?
- Affordability: Consumer Edge Credit & Debit Card Behavioral & Demographic Transaction Data
- How does household consumer spending correlate with rent burden? Are renters in high-price ZIPs cutting discretionary spending?
- Macro BrightQuery Occupational Wage
- Are landlords capturing local wage gains? Compare asking rent growth to occupational wage trends by ZIP code and industry sector
Ready to explore?
Access Dwellsy TotalIQ and all datasets above at app.deweydata.io
Questions or feedback? Reach us at [email protected]


.svg)