.svg)
Your Data, Your Environment: A Researcher's Guide to Dewey in R

Dewey’s job is to remove the friction between you and the data you need, so you can spend more time on the work that matters. That means meeting researchers where they already work. If your workflow lives in R, Dewey fits in without asking you to change a thing.
This post walks through a complete R workflow using the deweyr package with Advan’s Neighborhood Patterns Plus dataset: download, load, filter, and visualize. Start to finish, in one short script.
Technical guides used in this example workflow
- Working with R — Dewey Docs guide explaining all options for downloading and working with Dewey data in R, including the deweyr package.
- deweyr Package Reference — Full function docs, argument tables, and usage examples.
- deweyr_supp.R — Downloadable R script used in this guide. Swap in your own dataset and run it yourself.

Working with Dewey's datasets: Advan's foot traffic data
For this walkthrough we’re using Advan Neighborhood Patterns Plus, a mobility dataset tracking human foot traffic at the census block group (CBG) level across the US and Canada, updated monthly from 2019 to present. It captures where people stop, how long they stay, what day they visit, and what other destinations they frequent, all aggregated to the neighborhood level with no individual-level data exposed.
Install, Filter, and Load Options
The recommended path is deweyr, Dewey’s official R package. Install it from GitHub in two lines:
## R — INSTALL
# Install deweyr from GitHub
install.packages("pak")
pak::pak("Dewey-Data/deweyr")
Once installed, there are three ways to download data depending on your needs.
1. download_dewey() — recommended for most users
A single function call downloads your dataset to disk. Behind the scenes, deweyr uses UV (a fast, lightweight Python environment manager) to run Dewey's download library automatically. No Python installation or configuration required on your end.
## R — DATE-PARTITIONED DOWNLOAD
library(deweyr)


download_dewey(
  api_key              = Sys.getenv("DEWEY_API_KEY"),
  folder_id            = "your-folder-id",
  download_path        = "~/Documents/dewey-downloads/advan-neighborhood",
  partition_key_after  = "2024-01-01",
  partition_key_before = "2025-01-01"
)
For large monthly datasets (like Advan Neighborhood Patterns Plus), date partitioning is strongly recommended. It limits the download to only the files you need rather than pulling the full archive. Files land in the folder you specify, organized by partition.
Finding your folder ID: The folder_id comes from the API URL in your Projects folder (not the dataset landing page). First, add the dataset to a Project, then from your Projects page, find the dataset and navigate to Get Data > Skip filtering > Bulk API > API URL — your prj_ ID is embedded in that URL.

2. download_dewey_py() — legacy option
Functionally similar to download_dewey(), but requires Python to already be installed on your machine. This exists for users who set up a Python environment before UV-based downloading was introduced. If download_dewey() works for you, there's no reason to use this one.
3. download_dewey_duck() — when you want to filter before downloading
If your dataset is very large and you only need a specific slice (certain columns, a date range, a filtered subset of rows, etc.), download_dewey_duck() applies those filters before data lands on disk using DuckDB. This is covered in depth below, where it's paired with preview_dewey_duck() and read_dewey_duck() as a complete workflow
Navigating large datasets with DuckDB wrapper
After the download completes, your files land in the folder specified by download_path, organized into subfolders by partition (typically one per month). Many Dewey datasets are delivered as .parquet files, a columnar format built for fast analytical queries. We recommend working with parquet when available. For large datasets like Advan Neighborhood Patterns Plus , where the California slice alone is approximately 59 GB, you’ll want to preview the schema and filter before loading anything into R memory.
deweyr includes a built-in DuckDB wrapper that handles this cleanly, without needing to write raw SQL. Start with preview_dewey_duck() to inspect column names and types before committing to a download:
## R — PREVIEW SCHEMA (NO DOWNLOAD REQUIRED)
api_key <- Sys.getenv("DEWEY_API_KEY")
data_id <- "your-data-id"


# Column names only
colnames(preview_dewey_duck(api_key, data_id, limit = 0))


# Preview first 10 rows
preview_dewey_duck(api_key, data_id)
Once you know your column names, use download_dewey_duck() to download with a filter applied, then pipe directly into read_dewey_duck() to load into R:
## R — DOWNLOAD, FILTER, AND READ
# Download filtered data and read into R in one pipeline
data <- download_dewey_duck(
  api_key   = api_key,
  data_id   = data_id,
  partition = "DATE_RANGE_START",
  where     = "DATE_RANGE_START >= '2024-01-01' AND DATE_RANGE_START < '2025-01-01'",
  select    = c("AREA", "AREA_TYPE", "REGION", "YEAR", "MONTH",
               "DATE_RANGE_START", "DATE_RANGE_END",
               "STOP_COUNTS", "DEVICE_COUNTS", "MEDIAN_DWELL",
               "DAY_COUNTS", "STOPS_BY_DAY", "TOP_SAME_MONTH_BRAND")
) |>
  read_dewey_duck()

Visualize and Analyze with ggplot2
With filtered data in memory, ggplot2 takes over. The charts below came directly from the ADVAN dataset, visualizing the kinds of questions you might be interested in answering:
Which brands do Californians visit alongside their neighborhoods?
The TOP_SAME_MONTH_BRAND field stores a JSON object per CBG-month recording the brands most commonly co-visited by devices that stopped in that neighborhood. Parsing and summing scores across all CBGs surfaces which brands have the broadest footprint across the state.
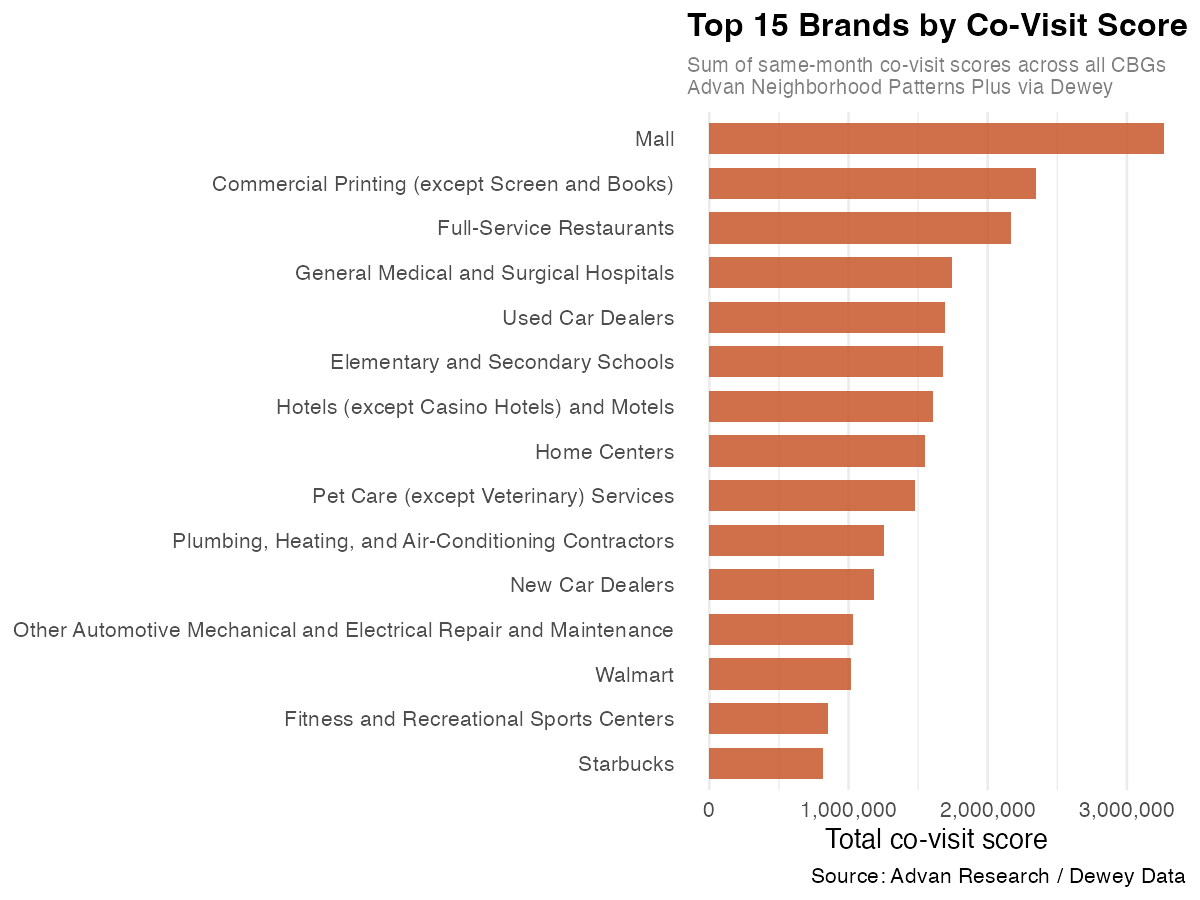
Figure 1. Top 15 brands by summed same-month co-visit scores across all California CBGs, Jan–Feb 2024. Scores represent the relative frequency with which devices visiting a given CBG also visited each brand that month. Source: Advan Neighborhood Patterns Plus / Dewey Data.
Malls rank highest by a clear margin, reflecting their role as anchor destinations that draw visitors from many surrounding neighborhoods at once. The presence of categories like “Commercial Printing” and “General Medical and Surgical Hospitals” alongside retail names is a reminder that this data captures the full texture of where people go, not just consumer destinations.
The same analysis can be faceted by AREA_TYPE to reveal how co-visit patterns shift across neighborhood classifications:
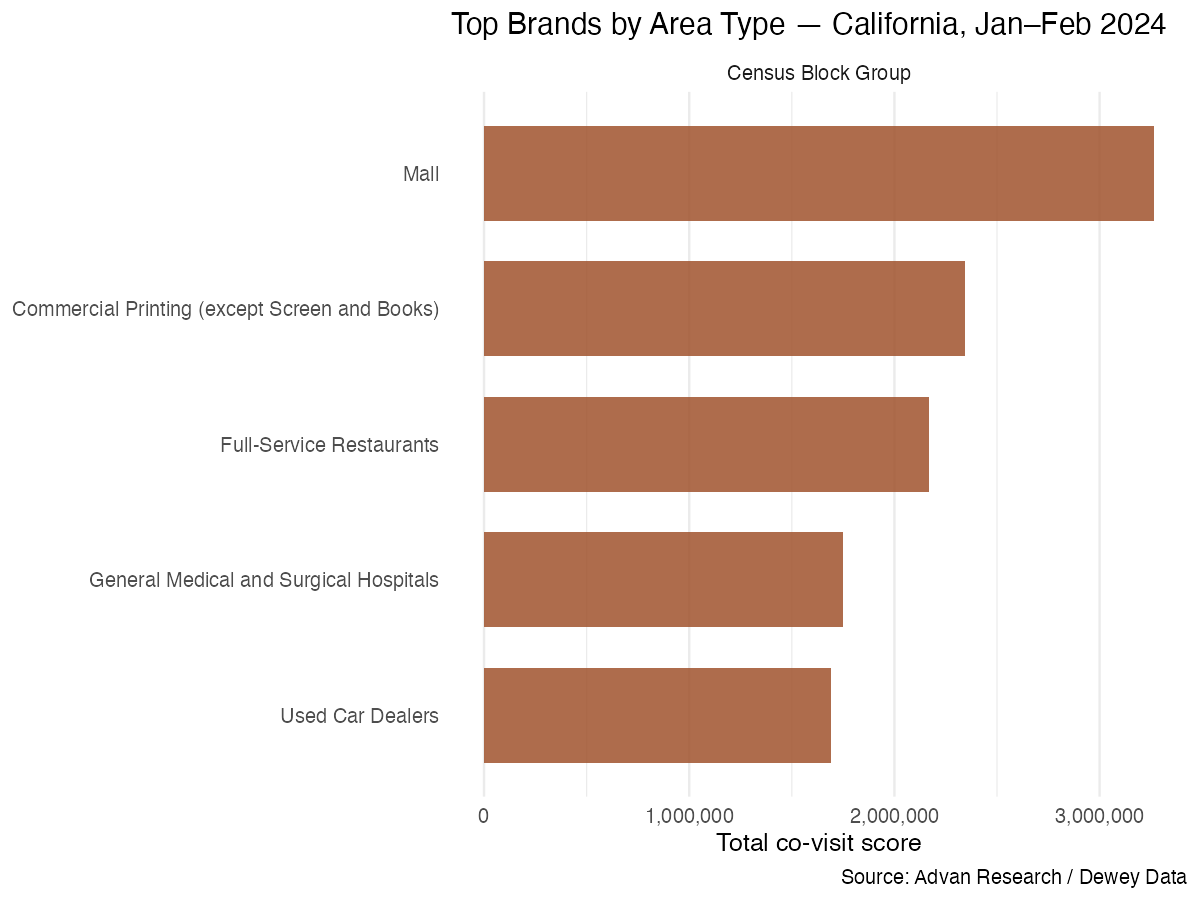
Figure 2. Top brands faceted by CBG area type — California, Jan–Feb 2024. A full-year download would surface distinctions across residential, commercial, and mixed-use classifications. Source: Advan Research / Dewey Data.
How does foot traffic vary across a calendar month?
STOPS_BY_DAY contains one stop count per calendar day per CBG-month. Averaging across all California CBGs gives a clear picture of daily neighborhood activity across the state.
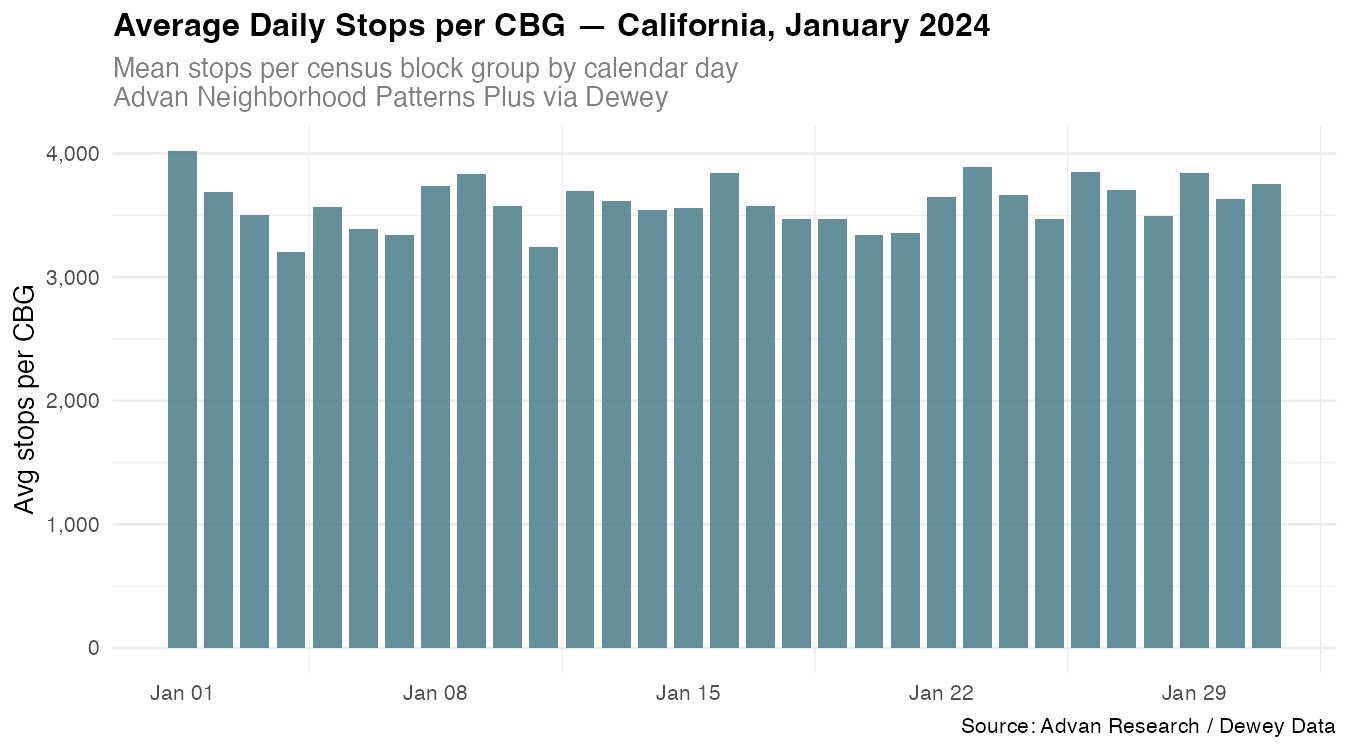
Figure 3. Average daily stops per CBG across all California census block groups, January 2024. The elevated bar on Jan 1 reflects New Year’s Day activity; the recurring weekly dips correspond to weekend patterns in commercial and office-area CBGs. Source: Advan Research / Dewey Data.
The New Year’s Day spike is visible immediately. The weekly rhythm of higher and lower activity is readable throughout the month, and the floor never drops below ~3,200 stops per CBG , a reflection of California’s density even on quiet days.
The Reproducible Script
Every step in this walkthrough is contained in a single annotated R script, which is free to download, adapt, and build on. Replace the folder ID, date range, and column selection with your own dataset and the rest carries over.
The script includes the full download_dewey() argument dictionary, schema preview patterns, both the DuckDB wrapper and raw DuckDB loading options, and the complete visualization code for the charts above. Uncomment what you need, swap in your dataset, and go.

RESOURCES
- Working with R — Dewey Docs guide explaining all options for downloading and working with Dewey data in R, including the deweyr package.
- deweyr Package Reference — Full function docs, argument tables, and usage examples.
- deweyr_supp.R — Downloadable R script used in this guide. Swap in your own dataset and run it yourself.
- Advan Neighborhood Patterns Plus — Dataset documentation
- SafeGraph vs. Advan — Methodology differences


.svg)